This project attempts to address a basic problem for all scholarship on Africa that treats where things happen as necessary to understanding how and why they happen: finding places on a map. Despite the existence of excellent public maps for Africa, to date there is no common source that allows students, researchers, and the general public to: We're always looking for geospatial data to teach with. Finding data for the U.S. is relatively easy, but finding data for other places has often been more challenging. AfricaMap is a web mapping interface created by Harvard University's Center for Geographic Analysis that can be used stand-alone in a classroom because there is a rich set of data available for viewing. The layers that I looked at, some shown below, drew quickly and came with a legend(!). Very nice accomplishment for CGA after being in operation just under three years. Here is a description of the AfricaMap project:
"AfricaMap is based on the Harvard University Geospatial Infrastructure (HUG) platform, and was developed by the Center for Geographic Analysis to make spatial data on Africa easier for researchers to discover and explore.
Sounds great! Here are some maps available through the AfricaMap site and some comments on how to use the site. The above map is the 1722 Delisle Carte d'Afrique found under Map Layers -> Historic Maps 1600 to 1800. I lead with this map because I love old maps.
 This map shows a map of ethnolinguistic families (mapped in 2001). Remember to add the Legend found over to the right in Map Layers.
 Under the Environmental layer, you will find just three layers, rivers, soils and, shown above, surficial geology. Note that this legend is not all that useful.
 AfricaMap allows for downloading of their data, but only some of the layers are currently available. That may be, in part, why they this web map is in beta. How to get to the download function: Click on Map Layers, scroll all the way over to the right. There is a Download tab, don't click there, follow the arrow down to your layer and click "download" there. If the data are available, you will be taken to the web page and source of the geospatial data, if not available, you will be given this message "Mapping data will be made available for download." That is quite hopeful.
Thanks go to Diana Sinton for sharing this web map site.
Wednesday, October 21, 2009
Mapping Africa
Monday, October 12, 2009
Adding a Map to Your Web Page - From ESRI
There are many ways to add a map to a web page. Here is one more from ESRI. It's called Mapping For Everyone and it is in Beta. This is U.S. only.
What you see above is a choropleth map of the City of Poughkeepsie (New York) by unemployment rate, a rather hot topic! This is tract-level data. The data source is "estimated July 1, 2009 unemployment rate in the United States." There are currently only seven different demographic variables to map, but since this is in beta and since people love to map demographics of all sorts, my guess is that ESRI will add more data.
Here's what you do:
 1) Enter a zip code, then 2) choose a demographic variable from the drop-down list, 3) size your map to the dimensions of your web page (for instance, the map above is 500 pixels wide), then 4) share your map, either as a link, or as html code to embed into your web page.
Thanks for the tweet, Joseph Kerski!
Tuesday, October 06, 2009
Part II: Calculating Point Locations
I probably posted my blog post, Calculating Point Locations from One Known Point, Distance and Direction, too soon. I got some more great advice from Andy Anderson at Amherst College, who said it was okay if I shared this here. He calculated out the trig for me. Thanks, Andy!
Here's my solution, which stays in ArcGIS, and may well be more accurate in general than the other two solutions you found (i.e. do you know exactly what procedure Map Maker is using?). In general this isn't a simple problem. It can be approximated either by projecting the coordinates such that there is low distortion over the region covered by the lines, or by assuming a spherical Earth and using spherical trigonometry. The other issue is that a rhumb line is not in general the same as a geodesic, though again over a small region they are basically the same.
I'm going to assume that you are working over a small region. Here's one way to do it, using the Mercator projection, which by design keeps rhumb lines correct, or another way to say it is that a 1-m change in x will cover the same distance on the map as a 1-m change in y.
1) Format your data more or less as follows in a file that ends with .csv:
Longitude,Latitude,Length_m,Dir_deg
-72,43,100,30
-72,43,96,15
...
The length is assumed to be meters, direction in degrees clockwise from north (i.e. the azimuth). The central point is repeated here since it might conceivably change and because the calculations we'll use to generate the distant points all start with that point.
2) Open ArcGIS, preferably a new blank document, then double-click on the data frame (usually named Layers), click on the tab Coordinate System, and navigate to Predefined > Projected Coordinate Systems > World > Mercator (world). This version is based on the datum WGS 84.
3) Menu Tools > Add XY Data... , and import the CSV file; in the dialog assign the correct datum for the above geographic coordinates. If it's not the same as WGS 84, pick an appropriate transformation. The data will be added as (file name) Events.
4) Right-click on (file name) Events and menu Data > Export Data… In the resulting dialog, in the button group Use the same coordinate system as:, click on the data frame. Choose a name and location for the shapefile and click the button OK. When you are asked Do you want to add the exported data to the map as a layer?, click on the button Yes.
5) Open ArcToolbox, then navigate to Data Management Tools > Features and double-click on Add XY Coordinates. In the menu Input Features, select the new shapefile and then click on the button OK. When the tool completes, click on the button Close.
6) Right-click on the new shapefile and menu Open Attribute Table. Two new fields will be present, POINT_X and POINT_Y, which will be Mercator coordinates in meters. Click on the button Options and menu Add Field..., and create a field with the Name: (for example) DISTANT_X with Type: Double. Repeat to create a field with the Name: DISTANT_Y.
7) Right-click on the header of the field DISTANT_X and menu Field Calculator…. In the field DISTANT_X =, type and/or click:
[POINT_X] + [Length_m] * Sin( [ Direction] * Atn(1) / 45 )
Then click the button OK. Now right-click on the header of the field DISTANT_Y and menu Field Calculator….
In the field DISTANT_Y =, type and/or click:
[POINT_Y] + [Length_m] * Cos( [ Direction] * Atn(1) / 45 )
Then click the button OK. Note that the trig functions Sin and Cos are reversed from the "usual" because the angle is azimuthal.
The trig functions "Atn(1)/45" is equal to the degree-radian conversion factor π/180.
8) DISTANT_X and DISTANT_Y are the new point positions. You can now turn them into their own point layer in ArcToolbox by navigating to Data Management Tools > Layers and Table Views and double-clicking on Make XY Event Layer. Choose your shapefile as the XY Table and DISTANT_X and DISTANT_Y as the X Field and Y Field. Choose a name for the layer, and choose the Spatial Reference as Mercator (world) (probably easiest to import it from your shapefile). Click OK.
9) Due to a bug in ArcGIS, the Distant Point layer will not appear in the Table of Contents, which means you can't select it and export it immediately as a shapefile (as in Step 4 above). However, you can save it as an external layer file with ArcToolbox by navigating to Data Management Tools > Layers and Table Views and double-clicking on Save to Layer File; it will appear in the menu Input Layer. Then add it to ArcGIS. This file refers to the shapefile you created for its data, so don't let them get separated. Or, you can now export this file as in Step 4 above.
Andy then suggests that this could be streamlined in Model Builder, as I suggested in my question to the the New York GIS Help Desk. It's so reassuring having smart friends and colleagues!
Also, one more thing. This project is one in which a graduate student is marking conch locations and movements underwater. She is making the measurements alone, diving with scuba gear, and the distances are rather short, less than 15 meters. Cool, huh?
Sunday, October 04, 2009
Calculating Point Locations from One Known Point, Distance and Direction
 I put a call for help out on Twitter and on my posterous blog with a geospatial problem a UWI-CERMES student needed some help with. Though I called it a GIS question, I was called out for not saying explicitly that it was an ArcGIS question. After doing some web-digging and fumbling with the software and what I thought might work, I submitted my question to the always helpful New York State GIS Help Desk. I got an answer within a few hours (thanks, you're the best!). This service is available for those lucky enough to be in the great state of New York.
Here is the question and answer responses.
| Question: | |
| I have a known location point (latitude and longitude) which is my base station [shown as X, above]. I have points scattered around this known location [red points, above]. If I know the orientation direction (or angle or deflection) to each point from the base station and I know the length (distance) [blue lines, above], can I use ArcGIS to get the latitude and longitude of each point? I would like to automate this, if possible, in model builder as I have hundreds of these points to calculate. I tried the Distance-Direction tool but it doesn't seem to save my new endpoint to a table that I created. Plus I'd like to many of these, ideally, not one-by-one. | |
| Answer: | |
| Using out of the box functionality, you can create two-point lines by first clicking on the base point and then using the direction/length command to enter the parameters of the end point. You can then convert the nodes to points. Unfortunately, this interactive approach might not be ideal if you have many points to create. An alternative to this is to use a tool available in the ET GeoWizards extension (a third party extension available from ET Spatial Techniques) called Lines from Points, Directions and Distance that automates this process. Before running the tool you will need to create copies of the base point (one for each radial, or point scattered around the base) during an edit session, and then add the values for direction and distance to new fields for each entry in the attribute table (you could do this by manual entry or copy/paste after opening the attribute table in Microsoft Excel). The tool will then create lines radiating from the base point to the entered distance/directions. The lines can then be converted to points using the Polyline to Point tool in this same extension. For more information on the ET GeoWizards extension, http://www.ian-ko.com | |
I got some similar feedback from the Twitter community. Thanks, Laura Cerquozzi (geographygeek) for this:
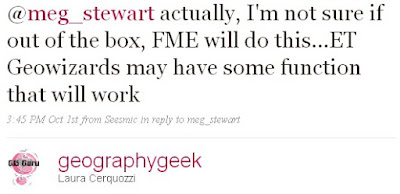
That seemed like reasonable advice. I'd give the ET Geowizards extension a try, see if there was a free trial version to use.
Ready for work with all my new advice from the geospatial community, I came into the office Friday afternoon and popped my head into the office of the folks having the geospatial issues. They had already figured it out using Map Maker Pro. I have never used Map Maker Pro not had I even heard of it prior to coming to the UWI. Map Maker Pro is a GIS software for Windows OS created out of the U.K. They must have hopped on that domain name early! There is also Map Maker Gratis. Looks like I'm learning a lot already!
To make this Map Maker Pro solution work for this problem, one needs to create a comma-delimited table that has the Direction and Distance for each point. Ideally, one also has a description-of-point column. In Map Maker, one has the known point, or base station, that one points to and then runs a calculation on the created table. The output file (in DBF format) gives the latitude and longitude of each point.
This problem goes down in the annals of Why Does It Have to be so Hard? using tools we already have. I scratch my head in wonder.
ADDED Oct 6, 2009: New information on how to calculate this problem using ArcGIS.
Friday, October 02, 2009
Geospatial Conference a Success
 Last week was the NITLE Geospatial Technologies in the Liberal Arts conference at Skidmore College. I mentioned the conference agenda here. Please read about the details of how the conference came out here at the NITLE blog and written by Sean Connin. Talks on open source GIS options, web mapping, virtual globes in teaching, mobile technologies, geospatial literacy, birds of a feather, mingling with other geospatial technologists, plus a keynote by Adena Schutzberg, Executive Editor of Directions Magazine. I wish I could have been there. Well done, folks!
Added Oct 5, from All Points Blog, Directions Magazine conference by Adena, with the great line at the end: "many even understand how (GPS) works. But, no one really knows what : A recap of the NITLE GeospatialGIS is." Too true.


