
Okay, so Google Earth isn't a true GIS. Not yet. You can't buffer layers, or run queries, or select points within a defined place. You can't even load GIS datasets (shapefiles) directly into Google Earth unless you have the pay-for-it version, Google Earth Pro ($400/seat). But, of course, Google Earth IS a GIS because we're given loads of layered, georeferenced data. We can turn those data layers off and on. And, truth-be-told, because Google supplies geographic data for the globe, and we have the world at our finger tips, we can get up and running with Google Earth a lot quicker than if we had to find geospatial data for, say the Yangtze River in China, or Banda Aceh, Sumatra, for example.
But let's look at some fun, easy-to-use tools that can be combined with Google Earth that will make your globetrotting experience a blast. These tools are free or already part of Google Earth and what I'm showing only scratches the surfaces of geospatial tools for Google Earth. There are more and more added to the pool all the time. Look at the "links" side of this blog under the heading "Geospatial Tools" for more.
These are a few of my favorite things to do with Google Earth.
Geocoding for Free and Viewing in Google Earth

Batch Geocode is terrific, easy to use and free. Geocoding in ArcGIS is not pleasant. Success rates hit a high of about 70 percent, in my experience. Batch Geocode is highly accurate and pretty fast.
Though Batch Geocode is freely available, if you find yourself using this great tool, please contribute.
Here's an example of addresses as tab delimited text that will work in Batch Geocode.
Because Batch Geocode gives you a longitude and latitude, you can easily bring your new table back into ArcMap.
Though it doesn't claim to do this, Batch Geocode does a terrific job on geocoding non-U.S. locations. I put in a list of foreign locations by city and country for places all over the world and got back really great results. The map isn't ready and it really isn't my data, so more on that later.
Time Sequencing - A brief history of the Tube
Google Earth came out with the time feature in September 2006. If your data have a time component, like walking along in the woods, just you and your Garmin, you're collecting the locations of your favorite vistas, but you are also getting a time stamp.
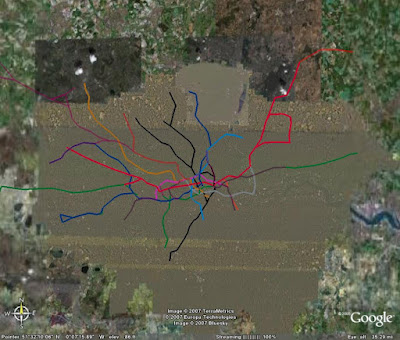
 London Underground - View in Google Earth
From the Google Earth Community contributor, known as Simon_a: “I would recommend setting the speed of the animation to slow (click on the clock icon next to the slider to find the menu).
This is not meant to be a terribly accurate and comprehensive history of Tube network - timespans and track sections are approximate - but it gives a nice impression of the growth of the system.”
Useful Yet Pretty Graphs of Your Geographic Data Using GE Graph
GE Graph is freeware that helps you create graphical representations of your geographic data.
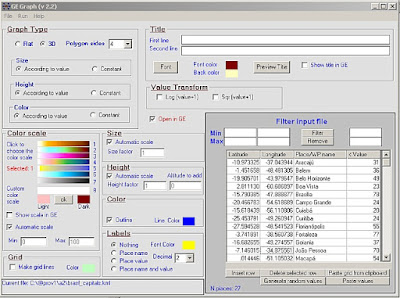
Here is an example of how we've used GE Graph with some locally collected data along the Casperkill Creek in Poughkeepsie, NY, this summer.Casperkill Project Ammonium - View in Google Earth
As we create KMLs and KMZs, we add them to the Vassar College folder under Education >> Tools. That's where you can find the graph above.
Exporting Shapefiles From ArcGIS to KML Format
So, you have to own ESRI's ArcGIS to do this next item. Most of the audience, being academic GIS professionals, probably owns it. But here is where you can find the discussion of the ESRI script to be used in ArcMap. That will get you started.
As an example, I took an Atlantic hurricane tracks shapefile containing over 37,000 tracks. It bogs down ArcMap and it bogs down Google Earth. This file crashed my Google Earth Pro. Here's what the file looks like in ArcMap:
 This is a screenshot of ArcMap and KML Exporter (shown larger than life). The hairball effect are hurricane tracks in the Atlantic Ocean. There are over 37,000 tracks in this file and it bogs down ArcMap and Google Earth Pro.
 When you click on the Google Earth icon (the shapefile-to-KML converter tool) from within ArcMap, you will get the dialog box shown above. The output KML will be colorized the way it is represented in ArcMap.
Hurricane Tracks in the Atlantic - View in Google Earth
Again, this KML can be found in the Vassar folder of the Google Earth Community .
U.S. Demographics Prepared for Viewing in Google Earth
To integrate some demographic data into a lecture, there is an interesting selection of 2000 census data available at Juice Analytics blog. These are all in KML format and for all 50 states. Of course, because Google Earth is not a true GIS, this census data cannot be changed or re-colorized, but I find it useful.
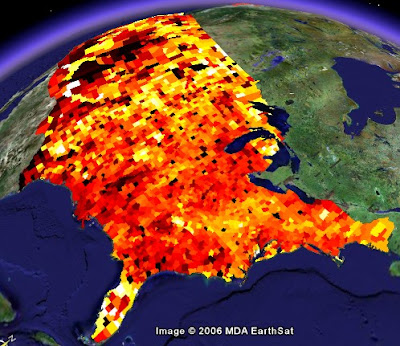
Take a look at population density for New York and keep the hurricane tracks KML open.
Image Overlay Example
Here are some instructions on how to do an image overlay in Google Earth. I won't write down what I've done today but you can refer to the Google link if you'd like to review how to do an image overlay.
Just know this...georectifying in Google Earth is pain-free!
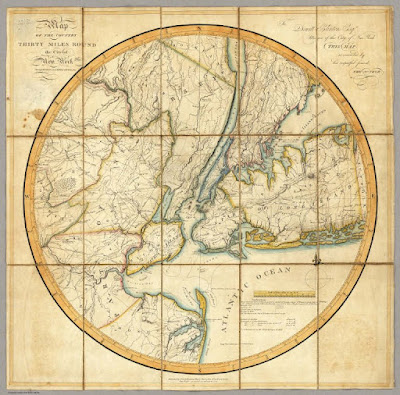
Leading Into the David Rumsey Collection

Under the heading of "Wait, There's (Always) More," Google Earth added in November 2006 under the Layers section and under the Featured Content section, access to some of David Rumsey's historical map collection.
Yes, this is very cool stuff. But David Rumsey has lot's more available maps for free download and at a variety of resolutions. Some of the maps are georectified already. I love old maps.
Touring a Place - China and the Yangtze River
No, you're right, this isn't a "GIS-like" function; I added this in because I think it's cool and fun to do.
Similar to a movie, you can create a "tour" of a place by using a lot of placemarks. This functions give a bird's eye view of a location and allows the tour creator to lead the viewer along.
This one is a work-in-progress, but it will give you an idea of what you can do with placemarks and touring. You can set the touring speed under Options.
Yangtze River Tour - View in Google Earth
The key to making a tour is to get down low, turn on vertical exaggeration, and tilt the view. Then what I like to do is with each placemark, put no icon and turn OFF the place name. Then when you play the tour, it looks more like you're flying.
I imagine that when this is done, I'll have put a thousand placemarks along the Yangtze. Ugh!
If you have any questions about this presentation, please email me at mestewart@vassar.edu


2 comments:
Hi Meg,
Thanks for posting these links - these are great examples of ways to use Google Earth. I'm working to map US Census data in Google Earth and I'm posting my progress on CensusKML. Where the project will take me, I'm not sure, but I'm sharing my work (code & KML/KMZs) as I progress.
Aidan
Thanks for sharing..
well written post. Quite informative.
regards
Aerial Triangulation
Post a Comment