Virtual Globes Symposium (email from Patrick Florance)
Hello,
I just wanted to make everyone aware of an upcoming symposium on VirtualGlobes in educational technology (i.e., Google Earth, NASA World Wind, ArcGIS Explorer, etc.). It's a really good group of speakers, and therewill even be a guest appearance by NITLE's very own celebrity Jon Caris of Smith College. Please feel free to circulate. The announcement follows.
Thank you,
Patrick
Will do, Patrick!
Registration is now open for NERCOMP's upcoming workshop:
*"VIRTUAL GLOBES: GIS 2.0"
DATE:
*January 19, 2007
*DESCRIPTION:*
Virtual Globes are being used increasingly by the news media; federal, state and local agencies; teachers; commercial agencies, and by people of all ages for personal use. A Virtual Globe is a three-dimensional software interface that allows users to observe and manipulate representations of the Earth or other worlds from a variety of views over the Internet. Users can often customize their own Virtual Globes by adding place makers or other geographic information such as satellite imagery, buildings, roads, demographics, etc. Virtual Globes have enormous potential for incorporating spatial information and spatial reasoning within a learning environment. A variety of Virtual Globe products and applications will be presented followed by a discussion ofthe various technologies.
For a full schedule and registration information, please go to:http://www.nercomp.org/events/event_single.aspx?id=643
*TIME:*
9:00- 3:15 (Coffee and Registration start at 8:00)
*PRICE:*
NERCOMP Members: $111, Non-Members: $211
*LOCATION:*
Southbridge Hotel & Conference Center Southbridge, MA.
Patrick Florance
GIS Manager & Senior GIS Specialist
Academic Technology
Tufts University
16 Dearborn Rd.
Somerville, MA, USA 02135
patrick.florance@tufts.edu
phone: 617.627.4235
Wednesday, December 20, 2006


Tuesday, December 19, 2006
More on Area Calculations
Remember when Keri wondered how to measure an area in her map?
Well, Kirsten wondered the same thing (what a concept...needing to know an area of a region in a map using GIS!! Why must it be difficult!?). She found an ArcScript called Graphic Measures (ArcMap 9) Worked like a charm. A separate window pops up and measures the length and area of the graphic that you've draw in your map. No need to make a shapefile.
http://arcscripts.esri.com/details.asp?dbid=13515
Tuesday, December 12, 2006
What's Harvard Up To These Days?
Seems Harvard University dropped the Geography department back in 1948. Now, thanks to geospatial guru and Harvard grad, Jack Dangermond, they have a swanky new GIS lab.

Hello, Geotech
"Modeling our world," geography returns to Harvard
by Christopher Reed
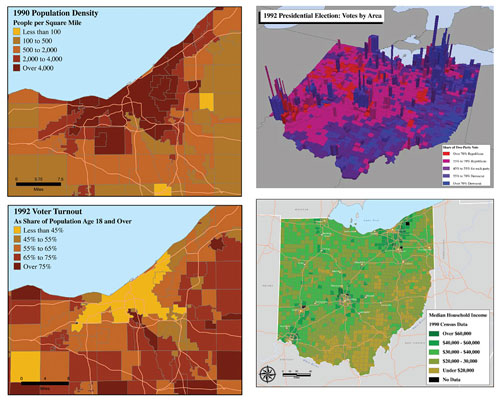
Take your geographic information system (GIS) for a spin around the block. It’s easy. Sit at your computer, which you have loaded with GIS software, and call up on the monitor a street map of Greater Boston. Superimpose on it a second map showing the household incomes of the citizenry. Those with the best dental work are in the suburbs, struggling scholars in Cambridge, the poor in the inner city. Add a third layer of census ethnicity information. All these data are public and readily available. Top it off with lines and dots showing Massachusetts Bay Transportation Authority bus routes and subway stations. Almost everyone is near a stop except in one big chunk of the city south of downtown. Your multilayered map will reveal to you what you might not have otherwise perceived, that the poorest, blackest Bostonians, in Roxbury and Dorchester, the ones least able to afford cars, are the least well served by public transportation.
Saturday, December 09, 2006
And Finally...ESRI has released their Virtual Globe - ArcGIS Explorer
ESRI is pleased to announce that ArcGIS Explorer is now available for download. Use your ESRI Global Account to log in and download ArcGIS Explorer.
ArcGIS Explorer is a lightweight desktop client for ArcGIS Server, providing a way for you to publish ArcGIS Server capabilities within your organization or to anyone on the Web. ArcGIS Explorer is freely distributable and does not require any other ESRI software.
Using ArcGIS Explorer you can connect to content published by ESRI and others and fuse it with your own ArcGIS services or local data. You can create your own content or tasks for ArcGIS Explorer by authoring globes and tasks using ArcGIS Desktop, then publishing it to ArcGIS Explorer via ArcGIS Server.
Ready-to-Use Globe DataTo get started with ArcGIS Explorer, you can access a collection of ArcGIS Online globes including worldwide streets, terrain, boundaries and labels, political maps, physiography, and more. All of these are meant to form a foundation on which you can publish your own content. Once you have downloaded ArcGIS Explorer, you can connect to these via the ArcGIS Explorer Resource Center.
Centrally Managed TasksYou can use ArcGIS Server to publish custom tasks for ArcGIS Explorer. Tasks may include advanced geoprocessing and GIS analytic capabilities such as viewshed analysis, terrain profiling, and other ArcGIS Server functions without the need for programming. These tasks can be saved in specific maps for specific users, or they can be delivered independently. Because tasks are centrally managed on the server, once you make an update to a task, it's automatically propagated to all users that are connected to it.
Customizable and ConfigurableArcGIS Explorer can be customized to suit your preferences and needs by changing the startup globes and tasks which are available, changing the look and feel of the application, or authoring custom tasks.
ArcGIS Explorer also includes a software development kit (SDK) that can be used to extend tasks or can be used to implement completely custom tasks that are driven by other Web services.
Learn MoreLearn more by listening to a podcast [MP3 - 7.04MB] from ESRI.
Friday, December 08, 2006
ANNOUNCEMENT -- GIS Conference at Skidmore: January 10
We plan two sessions at our Winter regional conference. Both will be discussion-based. The morning session will be on specific applications of GIS that go beyond the common applications. The afternoon session will be a discussion about how to handle/integrate such popular applications such as Google Earth with GIS. The tentative agenda will be:
9:30 AM Welcome and refreshments
10:00 AM to Noon: Creative, new, different applications of GIS.
Noon to 1:00 PM: Lunch
1:00 – 3:00 PM: How should academic GIS programs handle or integrate such web-based software such as Google Earth, NASA World Wind, etc.
If you would like to give a brief presentation of an application of GIS that may be rare or unique, or if you are integrating Google Earth, World Wind or other web-based geographic programs, let me know so that I can place you on the program to get the discussion going on these issues.
Please send your thoughts to me, rjones@skidmore.edu
We look forward to seeing you on Wednesday, January 10th. More details will follow in a couple of weeks."
Monday, December 04, 2006
A Breakdown of Virtual Globes and their Compatibilities with a Mac or a Windows Machine
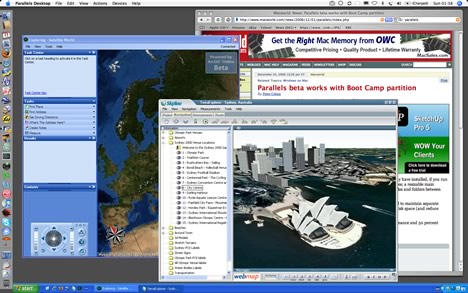
"Ogle Earth" - 1 new article Run ArcGIS Explorer on your MacHere's a fun GIS party trick: Run ArcGIS Explorer as an application inside Mac OS X. While you're at it, run SkylineGlobe as well: (Click on the image to enlarge)
No, they didn't just come out with Mac versions. Instead, Parallels came out with an update to its excellent Windows virtualization software for Mac. Two new features were added: The ability to run individual Windows applications just like any Mac application right in the OS X GUI, and the ability to use the Boot Camp partition with Parallels. The first feature makes it look great, but what does the second feature mean? Apple already lets you boot into a separate partition on your Mac where you can run Window XP or Vista natively on the Intel Core Duo processor. Parallels, meanwhile, lets you create and run virtual disks with all kinds of Windows or Linux installs, and with virtually no speed penalty. With this latest update, Parallels now also lets you run your Boot Camp install from within Mac OS X, simultaneously. Before, you had to reboot if you wanted to use Boot Camp. There is just one thing missing, still, in Parallels: 3D hardware acceleration. You do get full OpenGL and DirectX support in Boot Camp, so you can still reboot into it if you really want to access 3D functionality on your Mac, but that takes minutes. Parallels promises to add 3D hardware acceleration support in the coming months, but until then, here's a rundown of compatibility for the current set of virtual globes. Mac OS X: Windows via Parallels in Mac OS X: Windows in BootCamp: So although NASA World Wind and Microsoft Virtual Earth 3D are currently not accessible via Parallels' solution, this will change in a matter of months, either because the Java version of NASA World Wind has come out, or because Parallels adds 3D hardware support to their product. None of this should mean that developers can stop developing for the Mac, of course. To use Parallels or Boot Camp with Windows, you need to own a copy of XP or Vista, and that's not cheap. |
Wednesday, November 22, 2006
Google Earth KMLs can now be viewed in Google Maps


Monday, November 13, 2006
Google Earth and Old Maps?!? Be still my heart!
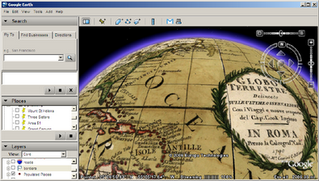
Google Earth in 4D by ZDNet's Garett Rogers -- Google skipped right past the third dimension and landed directly in the fourth (time) by offering historical maps on Google Earth. Now you can travel back in time — for example, I am looking at the globe of 1790. Don't expect detailed high resolution photography from days gone by, but it's still interesting to see [...]
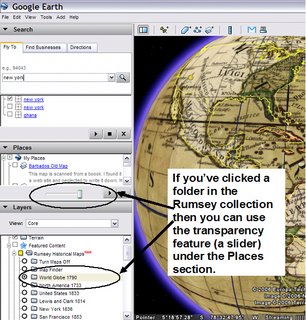
So, in order to make these fantastic archival maps transparent, look at the image below. If you cannot read it, you have to select the folder (highlight it) in the Rumsey collection under the Featured Content and then up in the Places section you'll see the Transparency slider.
Saturday, November 04, 2006
In this lab we’ll perform some of the analytical steps you can use to understand the distribution of stream quality parameters, or of risk factors that influence a stream.
The directions in this lab are somewhat terse, in part because I think much of the methods involved are communicated easiest verbally, and in part because it takes a lot of precious time to read directions in the current context. Please do your best to remain flexible, and if you find yourself becoming frustrated with the software, consult with your neighbors and the instructors to sort out a solution. Often we learn a great deal by making mistakes.
We will practice importing points, changing symbols, buffering and clipping, and basic map design as a group. Then you will have time to work on your own. We’ll try to include some show-and-tell to display your work to the group.
Taking notes: it’s hard to pause for note-taking, but it’s a good idea! You will not remember the steps taken today if you don’t take notes. I strongly recommend note taking!
Here is where you’ll find the tools you need:
Symbology: change the colors, sizes, grouping, and so on for point, line, or polygon features by opening the Properties window (double-click or right-click on the layer name), then click on the Symbology tab
Buffer tool: in the Toolbox (click on the red toolbox button to open it), search for the Buffer tool. (normally, use Dissolve Type: ALL)
Clip, Dissolve, and Calculate area are also in the Toolbox (search by name)
To examine attributes of selected features: open the attribute table of the layer: right-click on the name of the layer. You can then use Statistics to calculate mean, min, max, and histogram.
Screen capture windows (to paste in a word document): Alt-print screen copies the active window, such as a histogram report. Ctrl-V to paste in a word document.
Plot the Casperkill sample sites as points (“events”), using their coordinate locations.
Display the points using point symbols graduated to express data values.
Buffer the stream (at 50, 100, 500, 1000 m).
Clip digitized land use by the buffered area, then calculate area of different classes of land use.
Create a new point shapefile and identify risk factors to the stream, and show those risk factors to the class.
Produce a map (without air photos, but with a legend and scale bar) showing your findings from some (probably not all) of the work above. Write a 1-2 page analysis that explains what you can interpret from what you see in the map. You will be graded on the thoughtfulness of your writing, not on the depth of your GIS work. Your GIS analysis may be very simple, but try to think thoroughly about the evidence you have, the questions it raises, and the information that can be found in it about environmental factors affecting the stream.
As you write, practice writing cleanly and accurately. Stick close to the map and avoid sweeping generalizations, sloppy grammar, and other careless habits. Any figures or tables appended to your written work should have captions, and you should clearly explain what each figure or table shows and what the reader is to learn from it.
digitized data values:
1 = trees
2 = neighborhoods
3 = parking lots
4 = mowed grass
5 = open water
90 = roads
Thursday, November 02, 2006
Five College GIS Day - Pioneer Valley, Massachusetts
If you are nearby, or in the region, or even farther away, you are
invited to attend our Five College GIS Day!
All events are on November 8, 2006 at Amherst College in Amherst,
Massachusetts (72° 31' W, 42° 22' N).
Full information can be found here:
http://www.amherst.edu/it/ats/gisday/
You can contact me if you have other questions, or just to let me
know you're coming (and maybe bringing a poster, hint, hint).
The schedule is as follows. All events are free and open to the public.
Thanks,
-- Andy
****************************************************
10:30 AM - 11:30 AM
GIS and Demography: Methods, Analysis, Results
Dr. Ian Gregory, Digital Humanities-Department of History, Lancaster
University, UK
A seminar for experienced users of GIS, applicable to history,
sociology, economics, et al.
12:00 Noon - 12:50 PM
Teaching History with Geographic Information Systems
Prof. Robert M. Schwartz, E. Nevius Rodman Professor of History, Mt.
Holyoke College, MA
Discover how GIS can help introduce quantitative methods into history
and other subjects.
2:00 PM - 4:00 PM
GIS Poster Session
Everyone is invited to set up posters demonstrating academic
applications of GIS.
Visitors can take a short poster quiz to be included in a drawing to
win a door prize, including a GPS receiver!
4:00 PM - 5:00 PM
GIS and the Exploration of French Society and Culture
Prof. Joel Goldfield, Chair of Modern Languages and Literatures,
Fairfield University, CT
Learn how students used GIS-based projects to collaborate across
multiple disciplines.
7:30 PM - 9:00 PM
The Journey of Man: A Genetic Odyssey
Dr. Spencer Wells, Explorer-in-Residence, The National Geographic
Society,
and Project Director of the Genographic Project
Roughly sixty thousand years ago our ancestors began to spread out
across Africa and throughout the world. Our keynote speaker has
mapped this prehistoric journey using cutting-edge genetic research
informed by archaeology, linguistics, and climatology.
****************************************************
P.S. I know we're early, but November 8 fits our academic schedule
better :-).
Andy Anderson, Ph.D.
Mathematical and Spatial Data Analysis Specialist
Academic Technology Services
Amherst College
413-542-2255
GIS Demos at Cornell Cooperative Extension - Millbrook, NY
From: Stacy Hoppen
Sent: Wednesday, November 01, 2006 2:22 PM
To: GIS SIG
Subject: Wed Nov 8, 2006 - 6:30 pm - 8:30 pm - Demos of Free GIS Software
To: GIS SIG
Reminder for our event next week, on GIS Day!
Wednesday Nov 8, 2006 - 6:30 pm - 8:30 pm
Conference Room A
Farm and Home Center
2715 Route 44, Millbrook, NY
Demonstrations of Free GIS Software
Review and demos of some of the free GIS software packages available for
download from Internet. Demos will be about 20 minutes for each software
package.
Google Earth and Google SketchUp - Joe Heggenstaller
3DEM - 3D visualization software - Stacy Hoppen
Build Out Analysis software from University of Vermont - Mark Doyle/Stacy
Hoppen
Quantum GIS - Jerry Ottaway
MicroCAM - Stacy Hoppen
Feel free to pass this on to anyone who may be interested. Hope to see you
there!
Stacy
Stacy Hoppen
Interim GIS Project Coordinator
Cornell Cooperative Extension, Environment Program Farm and Home Center
2715 Route 44
Millbrook, NY 12545
845-677-8223 x148
845-677-6563 fax


