Friday, October 20, 2006

Calculating Area in ArcMap - Why should it have to be so hard?

I got a call from Keri Van Camp in Biology who wanted to know if there was a way to easily calculate the acreage of a region on a map. I assume she meant to draw a polygon and have an answer spit out in a window next to the polygon. Seems a simple GIS task to me. I recall that XTools used to be able to do something like that, but it is no longer free. It's available for a 30 day trial.

XTools costs $1,500.00 for academic institutions. I will look into getting this for all of the labs that have ArcMap in them (GIS lab, Sci Vis lab, Mobile mapping lab number one, Mobile map lab number two (Vassar Farm tablets)).

This is what they say about XTools: "Originally developed as a set of useful vector spatial analysis, shape conversion and table management tools for ArcView GIS 3.x. XTools extension was then converted by Data East to ESRI ArcGIS environment and now is re-designed, enhanced and extended as XTools Pro to get to the newer level of functionality and performance."
Anyway, back to trying to get Keri an answer, this is what I sent her:

Try one of these two ESRI ArcScripts:

Number 1
http://arcscripts.esri.com/details.asp?dbid=13941

ESRI Description: Adds and populates ACREAGE and/or AREA field to the attribute table of a dataset. Will properly calculate acreage for projected data, regardless of the linear units (meters, feet) used in that projection. Some other scripts I've seen DO NOT account for the projection and will give you wrong results. Tested on ArcGIS 8.1 thru 9.0. Includes a readme file showing how to install.

Number 2
http://arcscripts.esri.com/details.asp?dbid=13910

ESRI Description: The Areal Interpolator is an extension that uses simple areal interpolation to calculate a variable for a given area. The tool assumes the variable is distributed uniformly over the area.

Go to http://www.healthgis-li.com/researchers/User_Guide.pdf (pg 153 of 189) for complete instructions on how to use the Areal Interpolator extension.

Thursday, October 19, 2006

Google Earth Pro and New Orleans Data

We now have Google Earth Pro in our GIS lab. (Thank you to Google's Dennis Reinhardt and National Geographic for the grant.) The best thing about this upgrade is that we can load GIS files directly into Google Earth. Shapefiles, MapInfo files (remember those?) and GoeTIFF files are all options. You can also make movies. I want to try to do a demo on movie making for the department.

Also, if you want to use some detailed data for New Orleans immediately following Hurricane Katrina, log in as either 'Katrina - NOAA' or 'Katrina - ImageAmerica' as shown below.
Then Zoom to New Orleans.

Monday, October 16, 2006

Mid-Hudson GIS Users Group - First Meeting

On October 16, we had a first meeting of the Mid-Hudson GIS Users Group. An email went out last June to invite participants from local area colleges and universities (Bard, Marist, Dutchess, Community College, Ulster County Community College, US Military Academy , SUNY New Paltz, and Mount Saint Mary College). I got back responses from three of these schools. One had to cancel last Friday.

Today’s attendees:
Meg Stewart, Vassar College
Brian McAdoo, Vassar College
Mark Halsey, Bard College
Jennifer Peters, Bard College
Sharon Kopyc, Bard College
Mark Lindeman, Bard College
Susan Winchell-Sweeney, Bard College
Christopher Lindner, Bard College
Sarah Love, Marist College
John Brockhaus, US Military Academy (unable to attend)

If you’re interested in the email list, please contact Meg Stewart.

The meeting got underway at 11:30 am in Ely Hall’s student lounge with a brief introduction by Meg Stewart. Everyone introduced themselves and said a little bit about what they do with GIS.

We then took a tour of the GIS facilities in Ely Hall. Meg talked about the GIS lab and the history of GIS use and teaching with GIS at Vassar. The department of Geology and Geography has taught with GIS since 1994 and the GIS lab was built in 1998. Meg also showed the group Mary Ann Cunningham’s research lab and the tablet PC lab.

We then got lunch and ate in the student lounge. Meg talked about what she thought was the appeal of organizing a GIS User’s Group in the region and how there are unique needs on college campuses for GIS support. Meg mentioned the original email that went out with ideas for topics of discussion for such a group: data sharing, computer lab management, supporting GIS projects in teaching and research on campus, software licensing issues, collaborative projects, and data management. Meg got the idea from attending a NITLE GIS workshop in March that discussed Managing and Supporting GIS on small campuses. NITLE is the National Institute for Technology and Liberal Education.

Mark Halsey thought this Mid-Hudson GIS Users group might establish at the local level what NITLE has at the national level.

Sharon Kopyc thought maybe this group could get a NITLE workshop organized to come to either Bard or Vassar and then open it up to the Users Group members. Neither school has had one yet. Mark H. thought that was a good idea but the group should get more established before pursuing the workshop.

Sarah Love said she was the only one on her campus (Marist) to support GIS. She wondered about who to talk to on her campus to increase the exposure, should she do demos, or GIS Day activity? She wondered about the downloading of data sets and could that be best organized through the library?

Meg said she’d send the link to the NITLE e-journal Transformations because it has many articles on how small colleges support a GIS program.

Sarah mentioned the Institute for Geospatial Technologies at Cayuga Community College. Perhaps partnering with them in some way?

Meg mentioned the Skidmore GIS workshop that met in June 2006. Sharon and Mark H went to this. Nick Napoli is the contact person at Skidmore College.

Mark Lindeman talked a bit about using the ICPSR (Inter-university Consortium for Political and Social Research) data. He uses the data all the time. Meg thought that ICPSR data might be a useful way to get social science faculty members, who are using these data already, to use GIS software to analyze the ICPSR data.

Sharon talked about Google Earth and reaching faculty members with Google Earth and other virtual globes.

Mark H wondered if we should work on bringing Google Earth to our campuses in a concerted way. Working on that technology as a starter rather than focusing on GIS workshop solely.

Sharon thought we should contact Diana Sinton, GIS Coordinator at NITLE. To ask how her Web-Mapping: Exploring Browser-Based Applications as Teaching and Learning Tools workshop went. Sharon also mentioned Jennie Lund at Connecticut College as a good resource.

Brian McAdoo mentioned looking into faculty enhancement grants, whether at ESRI or elsewhere. Brian said that ArcGIS is a tremendously difficult software to work with and that if a faculty member is going to try to learn it, he or she will need the time to devote to just learning the software. That it’s the kind of thing you learn in graduate school because you have the time, but once you’re out and teaching, you really don’t have the time to spend with the software if you’re teaching and doing your research at the same time.

Meg mentioned that what she sees at Vassar is that the students are flocking to GIS classes and that the enrollments have doubled. Vassar has had workshops for faculty, GIS Day activities, GIS speakers and there is always enthusiasm by faculty members but rarely a real follow-through with learning and using the GIS technology on the part of faculty members. There are exceptions to this rule. Meg thinks the growth of GIS at Vassar has come primarily from the students and sees the students leading the faculty to GIS.

We then reconvened in the GIS lab for a few brief discussions of projects.

Susan Winchell-Sweeney discussed the paper that she’ll give at the New York State GIS Conference later this month. She and a colleague mapped paleoindian archaeological sites from projectile point findings in the Hudson River Valley area near Bard College. The mapped the locations of archaeological sites versus chert-bearing bedrock and soil types.

Jennifer Peters has been working for the Environmental Protection Agency the past five months and has been using GIS to map probable locations of wetlands. Looking at hydric soils, bedrock fractures, and slope she is plotting the locations of possible wetlands. She is now ground-truthing her GIS analysis.

Meg talked about the Vassar GIS blog she started as a way to put exercises for faculty member’s classes up on the web. These exercises can be used at a later date by anyone. It is also a way to answer frequently asked questions and get that information to GIS users on campus. There are also links to data locations, virtual globes, other GIS blogs, information on tablet PCs, the GIS lab schedule, and links to vintage map sites.

Meg also showed how the tablet PC works with the ArcGIS software. The software is tablet PC-enabled and mapping can be done on the screen with a digitizing pen. You can also connect a GPS receiver to a USB port and stream locational data right into ArcGIS. Here’s a link to a blog entry from the Academic Commons she wrote recently about geospatial awareness thorugh using tablet PCs and GIS.

With a brief mention of thinking of ways to bring more local colleagues into the group and keeping in touch by email, we ended the meeting at 1:45 pm.

Thursday, October 12, 2006

Exporting Shapefiles to KML format - Export to KML 2.3.4

Here's the ESRI link to the that nice ArcScript for ArcMap 9.x. You can export a shapefile into a KML file for Google Earth viewing right from ArcMap. I'm giving the ESRI link so they can keep track of the downloads. They like that.

There seem to be endless examples of these scripts. I'll try more as time goes on.

Tuesday, October 03, 2006

Environmental Studies 254
Environmental Sciences in the Field -
Southern Louisiana
Exploring the Impacts of Katrina GIS Exercise


A good way to understand the effects of flooding after Hurricane Katrina is to map data such as land surface elevation, demographic information, and location of important infrastructure, such as hospitals and schools. In today's exercise, we will ask you to choose a portion of New Orleans, map several variables, and report to the class on your assessment of the areas inside and outside of the flooded areas.

Find a partner. You will work with this person in presenting your findings, but you may choose to work side-by-side as you look at the maps. Find the ArcMap project New_Orleans_exercise.mxd, which will be located in the directory C:\classes\Louisiana. Explore the layers available to you. Some of the main layers you'll be using include the following:


  • NO_mosaic: elevations, in meters, above and below mean sea level

  • CensusDVD_NewOrleans: variables from the 2000 census, by block group. There are several copies of this layer provided initially, to show a few of the many variables available

  • NOVA_floodline_poly: the outline of the flooded area in central New Orleans, as defined by the NOVA website

  • NO_neighborhoods: names of districts in the city


  • In addition you'll find a number of infrastructure and key location layers, such as roads, schools, cemeteries, and hospitals.


  • We'll look at a variety of demographic variables in the census data first as a group.

    Focus on Statistics for two Areas
    Now we'll focus on two neighborhood areas. Pay attention to the methods we use here because you'll have to work on your own later.

    To narrow our focus some, we'll examine the Lower Ninth Ward area and the Lakeview area in order to describe similarities and differences in distributions of census variables.

    Select the Lower Ninth area neighborhoods: open the attribute table for the NO_neighborhoods layer (right click on the layer name > open attribute table). Select the Lower Ninth Ward, St. Claude, and Bywater (hold down the Ctrl key to select multiple records in the table).

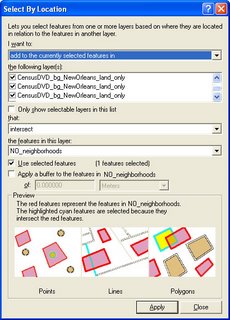
    Now get the census information for those neighborhoods: go to the Selection menu > Select by Location. Check the boxes to select features from the CensusDVD layers that intersect the features in NO_neighborhoods. Make sure the Use selected features box is checked on and make sure to check all of the CensusDVD_bg_NewOrleans layers. (See figure for example.)


    Now select any one of the CensusDVD layers in the map legend. Open its attribute table (right click > open attribute table).

    Find the field called AVGHHINC. Right click on the field name, then click on Statistics.

    Write down the Average household income for these block groups in the table below.

    Now select the Lakeview, Lakewood, and West End neighborhoods in the NO_neighborhoods layer. Then repeat the selection of census data to get a mean for those three neighborhoods. Make sure you know where those neighborhoods are. Write down the average household income for this area. Now summarize five other variables by neighborhood area and add them to your data table (there are extra spaces you may not need in the table). Descriptions of the different census variables can be found in the NO_GIS_project_census_labels.csv data table.


    Variable nameLower 9th areaLakeview area
    Avg household income  


    Comment on what you learn from these comparisons:


    Independent Work
    Now do the same selection process for the flooded and unflooded areas: You'll select features this time by whether or not they intersect the flood layer, "Flooded area." Find 5 factors you think are important in explaining flooding effects on the city's population. Variables could include such factors as depth of flooding in different areas, distributions of hospitals and schools, and locations of transportation infrastructure, as well as the census data. With your partner, thoroughly examine your chosen factors and prepare to explain your findings to the group. Your explanation should show that you've thoughtfully contemplated the implications of the features and variables you're discussing, and you should consider relationships between your variables/features.

    For your explanation, detail what you were looking at and how you carried out your analysis along with your results. Include screen captures of your maps (including legends) and paste them and your text explanations into this document. When you're finished, upload your copy to the Digital Dropbox on Blackboard. You will have the opportunity to show your word document to the class next week. We'll allot about 5 minutes per pair for the show-and-tell.

    MapIt - GIS software for Tablet PCs

    I heard about this software from NITLE's Diana Sinton. MapIt was developed for mapping on a tablet. Can't wait to try it out. Here's a link to the article by Mauro De Donatis and Lorenzo Bruciatelli in Computers & Geosciences. I got in touch with the De Donatis, so see the exchange below.

    Date: Oct 3, 2006 12:35 PM
    Dear Mr. De Donatis,

    I read with great interest your paper (with L. Bruciatelli) in Computers & Geosciences. I did not see how to obtain a copy of the software Map It. I would love to try it on tablet PCs. We've been using ESRI's ArcMap on Tablet PCs for mapping and for teaching students how to map, but Map It seems very intuitive. Could you send information on how I can get a copy of it to try out? We have twenty tablet PCs and, if we like Map It, we might want to put it on all of the tablets. So, please let me know the cost of loading the software on twenty machines.

    Many thanks,
    Meg Stewart


    Date: Oct 3, 2006 1:07 PM
    Dear Meg,

    I am very pleased to get your message.
    You can directly go to
    http://www.uniurb.it/ISDA/MAPIT/index.htm
    and you will find the way to download it.When you install Map IT in your tablet you can use the demo version.This version can do everything except saving.
    We are in a University and we can not sell anything. Moreover I have only the intellectual rights not the commercial ones.

    About costs. As I told you, I do not sell the sw. However I know the a license costs 1,200 Euros, but I am sure the cost for 20 machine will have a very strong reduction.
    I will ask to the reseller and I let you know.

    thank you and regards

    Prof. Mauro De Donatis

    Universita' degli Studi di Urbino "Carlo Bo" Facolta' di Scienze Ambientali - Campus Scientifico -
    Loc. Crocicchia - 61029 Urbino - Italy
    Tel. & Fax.: (int.+) 0722.304295 - E-mail:
    dedonatis@uniurb.it
    http://www.uniurb.it/ISDA/Pagine/home.htm