Wednesday, January 31, 2007

Google Earth and Geology

You never know what you'll find at 4am when you're kid wakes you up 'cause she's hungry and you can't get back to sleep. Well, I found a little Google Earth tidbit on an education blog that I thought relevant to the department. It's a screen cast of a geology demo in Google Earth from D'Arcy Norman's blog.


From the blog: The video is available in small H.264 format,which will work fine in iTunes and on iPods. It's also available in original large H.264 format and MPEG4.

Another cool thing to discover was the source of the KMLS used. San Diego State has a grea array of geological maps ready for Google Earth.


Nice job! Now, I really should try to sleep.

Wednesday, January 24, 2007

Graphics Measures Loaded in the GIS Lab


Back again with measuring in ArcMap. Just a little FYI, I loaded Graphics Measures in the lab. It looks like this (tiny red M circled), and will be in your Tools toolbar, between the X-Y tool and the Ruler tool.

Thursday, January 18, 2007

Viewing Web Mapping Service Imagery


I didn't write this or think this idea up, but I wanted to share this terrific resource available through Google Earth. Rather than be real 'bloggie' and make the reader click all over the web to find out how to view web mapping service data, I'll copy and paste the highlights for you here. This is sure to create hours of fun.

Pulled directly from Using Google Earth blog: "Using a web mapping service (WMS), you can view alternate images in Google Earth. These appear as image overlays. This lesser known feature set allows you to display this information from any publicly available WMS. Available information from a WMS can include weather, geological features, seismic hazards, population depictions, time zones, forestry regions and much more.

Tip: Before you begin exploring WMS offerings in Google Earth, be sure to zoom in to the particular area on the globe that you want to explore. This improves performance and lessens the demand on the WMS servers that generously provide this free information."

To do this, follow these instructions copied from the Google Earth help web site:

You can place Web Mapping Service (WMS) image overlays in Google Earth. These are mapping images that are provided through a WMS over the Internet. They can show you interesting information, such as weather formations and conditions, topographical maps, alternate high resolution satellite imagery and more.

To place an WMS image overlay:

1. Position the 3D viewer in the location where you want to place the overlay image file.

Try to position the viewer so that it corresponds in viewing altitude to the overlay. If the overlay is of a detailed view, zoom into the subject area so that you don't have to make large adjustments later. By contrast, if the overlay covers a large area, make sure the entire area is encompassed in the 3D viewer with some margins for adjusting the imagery.

2. Select Image Overlay from the Add menu (or use other shortcut methods described in Creating A New Placemark). The New Image Overlay dialog box appears.

3. In the New dialog box, click the Refresh tab.

4. Click WMS Parameters. The Web Mapping Service Parameters dialog box appears.

5. Beside WMS Service, choose an appropriate service or click Add to use a URL (website address) for a WMS. After a brief period of time, Google Earth populates the Opaque and/or Transparent Layers fields with available layers from the WMS you choose.

6. Choose the appropriate layer(s) and click Add -> to add the layer(s) to the Selected Layers field. This places this information in the WMS image overlay you will see in Google Earth. To remove a layer from the Selected Layers field, select it and click <-Remove.

7. To set the order of selected layers as they appear in the 3D viewer, select the appropriate layers in the Selected Layers field and click Move Up or Move Down.

8. When you are finished, click OK

9. Provide a descriptive name in the Name field.

10. Click OK and the WMS layer that you selected will show up in your Places section.

Then there's more from Frank Taylor at Google Earth Blog

NOAA Releases Estuarine Bathymetric Data for Google Earth

"I was contacted recently by NOAA regarding their release of bathymetry data for estuaries around the US. These colorful datasets "...are an interpolated data set representing the most up-to-date depth sounding information that was available at the time of publication (1998)." Read more about the data. You can view the page providing access to the GE files here, where you select a region and then select which estuary you want to view. Then look for a link to "Google Earth Visualization files". Here's a sample of the Pamlico Sound in North Carolina. Thanks NOAA!"

Friday, January 05, 2007

What Can I Do With Google Earth to Make it More Like a GIS?

Meg Stewart, Vassar College

January 10, 2007


Okay, so Google Earth isn't a true GIS. Not yet. You can't buffer layers, or run queries, or select points within a defined place. You can't even load GIS datasets (shapefiles) directly into Google Earth unless you have the pay-for-it version, Google Earth Pro ($400/seat). But, of course, Google Earth IS a GIS because we're given loads of layered, georeferenced data. We can turn those data layers off and on. And, truth-be-told, because Google supplies geographic data for the globe, and we have the world at our finger tips, we can get up and running with Google Earth a lot quicker than if we had to find geospatial data for, say the Yangtze River in China, or Banda Aceh, Sumatra, for example.

But let's look at some fun, easy-to-use tools that can be combined with Google Earth that will make your globetrotting experience a blast. These tools are free or already part of Google Earth and what I'm showing only scratches the surfaces of geospatial tools for Google Earth. There are more and more added to the pool all the time. Look at the "links" side of this blog under the heading "Geospatial Tools" for more.

These are a few of my favorite things to do with Google Earth.


Geocoding for Free and Viewing in Google Earth


Batch Geocode is terrific, easy to use and free. Geocoding in ArcGIS is not pleasant. Success rates hit a high of about 70 percent, in my experience. Batch Geocode is highly accurate and pretty fast.

Though Batch Geocode is freely available, if you find yourself using this great tool, please contribute.

Here's an example of addresses as tab delimited text that will work in Batch Geocode.

Because Batch Geocode gives you a longitude and latitude, you can easily bring your new table back into ArcMap.


Though it doesn't claim to do this, Batch Geocode does a terrific job on geocoding non-U.S. locations. I put in a list of foreign locations by city and country for places all over the world and got back really great results. The map isn't ready and it really isn't my data, so more on that later.


Time Sequencing - A brief history of the Tube

Google Earth came out with the time feature in September 2006. If your data have a time component, like walking along in the woods, just you and your Garmin, you're collecting the locations of your favorite vistas, but you are also getting a time stamp.
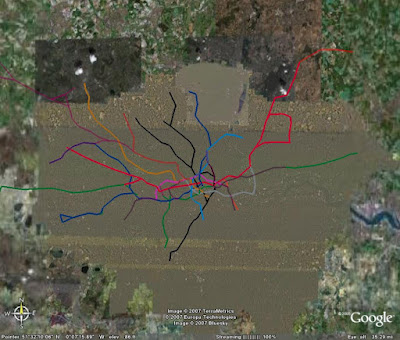

London Underground - View in Google Earth

From the Google Earth Community contributor, known as Simon_a: “I would recommend setting the speed of the animation to slow (click on the clock icon next to the slider to find the menu).

This is not meant to be a terribly accurate and comprehensive history of Tube network - timespans and track sections are approximate - but it gives a nice impression of the growth of the system.”


Useful Yet Pretty Graphs of Your Geographic Data Using GE Graph

GE Graph is freeware that helps you create graphical representations of your geographic data.
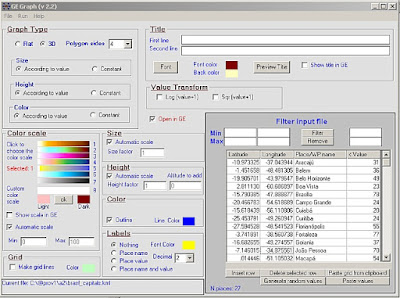


Here is an example of how we've used GE Graph with some locally collected data along the Casperkill Creek in Poughkeepsie, NY, this summer.

Casperkill Project Ammonium - View in Google Earth



As we create KMLs and KMZs, we add them to the Vassar College folder under Education >> Tools. That's where you can find the graph above.


Exporting Shapefiles From ArcGIS to KML Format

So, you have to own ESRI's ArcGIS to do this next item. Most of the audience, being academic GIS professionals, probably owns it. But here is where you can find the discussion of the ESRI script to be used in ArcMap. That will get you started.

As an example, I took an Atlantic hurricane tracks shapefile containing over 37,000 tracks. It bogs down ArcMap and it bogs down Google Earth. This file crashed my Google Earth Pro. Here's what the file looks like in ArcMap:

This is a screenshot of ArcMap and KML Exporter (shown larger than life). The hairball effect are hurricane tracks in the Atlantic Ocean. There are over 37,000 tracks in this file and it bogs down ArcMap and Google Earth Pro.


When you click on the Google Earth icon (the shapefile-to-KML converter tool) from within ArcMap, you will get the dialog box shown above. The output KML will be colorized the way it is represented in ArcMap.


Hurricane Tracks in the Atlantic - View in Google Earth


Again, this KML can be found in the Vassar folder of the Google Earth Community .


U.S. Demographics Prepared for Viewing in Google Earth

To integrate some demographic data into a lecture, there is an interesting selection of 2000 census data available at Juice Analytics blog. These are all in KML format and for all 50 states. Of course, because Google Earth is not a true GIS, this census data cannot be changed or re-colorized, but I find it useful.
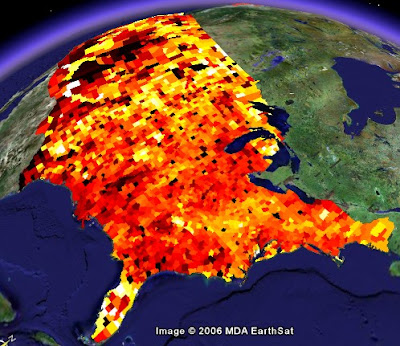


Take a look at population density for New York and keep the hurricane tracks KML open.


Image Overlay Example
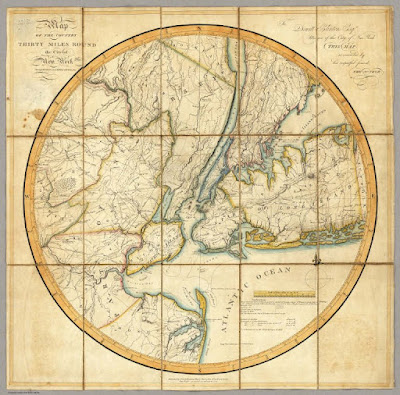


Here are some instructions on how to do an image overlay in Google Earth. I won't write down what I've done today but you can refer to the Google link if you'd like to review how to do an image overlay.

Just know this...georectifying in Google Earth is pain-free!


Leading Into the David Rumsey Collection


Under the heading of "Wait, There's (Always) More," Google Earth added in November 2006 under the Layers section and under the Featured Content section, access to some of David Rumsey's historical map collection.

Yes, this is very cool stuff. But David Rumsey has lot's more available maps for free download and at a variety of resolutions. Some of the maps are georectified already. I love old maps.


Touring a Place - China and the Yangtze River

No, you're right, this isn't a "GIS-like" function; I added this in because I think it's cool and fun to do.

Similar to a movie, you can create a "tour" of a place by using a lot of placemarks. This functions give a bird's eye view of a location and allows the tour creator to lead the viewer along.

This one is a work-in-progress, but it will give you an idea of what you can do with placemarks and touring. You can set the touring speed under Options.


Yangtze River Tour - View in Google Earth

The key to making a tour is to get down low, turn on vertical exaggeration, and tilt the view. Then what I like to do is with each placemark, put no icon and turn OFF the place name. Then when you play the tour, it looks more like you're flying.

I imagine that when this is done, I'll have put a thousand placemarks along the Yangtze. Ugh!


If you have any questions about this presentation, please email me at mestewart@vassar.edu

Wednesday, January 03, 2007

Google Earth Demo from Google Earth Team Member


In November, Google Earth Team's Jessica Pfund gave a one-hour Google Tech Talk that serves as a great introduction to Google Earth, its user interface and the things you can do with it beyond looking at your house. If you need a demonstration on how to use Google Earth and don't have a GIS person nearby t show you, check out this video to get you up and running (Thanks Ogle Earth).

Agenda for the Skidmore GIS Conference - January 10, 2007 (From Robert Jones, Skidmore College)

Attached is the program for the Skidmore GIS Conference for Educators. Our day begins at 9:30 AM and ends by 3:30 PM. As with our June conference, there will be a few presentations on applications of GIS and plenty of time for round table discussion of items on the agenda or other topics of common interest. Be sure to forward this message to colleagues who may be interested in attending.

You do not need to formally register, but I would appreciate knowing if you plan to attend.

I look forward to seeing you next week

-- Bob

PS: An aerial photo of the campus marking the entrance, parking area and GIS
Center is shown at the bottom of this email after the program

Robert Jones, Department of Economics
Skidmore College (518) 580-5094


Skidmore Regional GIS Conference for Educators
Wednesday January 10, 2007

Tentative Program
9:30 AM Welcome (Dana Atrium)

10:00 AM David Karp: Crime mapping with GIS
10:30AM Carol Cady: GIS hockey project
11:00 AM Kyle Nichols: Water well mapping with GIS
11:30 AM Discussion of less common applications of GIS

12:00 Noon Lunch Break

1:00 PM Meg Stewart: Google Earth as “GIS-lite”
1:30 PM Discussion of alternatives to ArcGIS such as Google Earth and Virtual Globe

3:30 PM Session Ends


Wednesday, December 20, 2006

Virtual Globes Symposium (email from Patrick Florance)

Hello,

I just wanted to make everyone aware of an upcoming symposium on VirtualGlobes in educational technology (i.e., Google Earth, NASA World Wind, ArcGIS Explorer, etc.). It's a really good group of speakers, and therewill even be a guest appearance by NITLE's very own celebrity Jon Caris of Smith College. Please feel free to circulate. The announcement follows.

Thank you,
Patrick

Will do, Patrick!

Registration is now open for NERCOMP's upcoming workshop:
*"VIRTUAL GLOBES: GIS 2.0"

DATE:
*January 19, 2007

*DESCRIPTION:*
Virtual Globes are being used increasingly by the news media; federal, state and local agencies; teachers; commercial agencies, and by people of all ages for personal use. A Virtual Globe is a three-dimensional software interface that allows users to observe and manipulate representations of the Earth or other worlds from a variety of views over the Internet. Users can often customize their own Virtual Globes by adding place makers or other geographic information such as satellite imagery, buildings, roads, demographics, etc. Virtual Globes have enormous potential for incorporating spatial information and spatial reasoning within a learning environment. A variety of Virtual Globe products and applications will be presented followed by a discussion ofthe various technologies.

For a full schedule and registration information, please go to:http://www.nercomp.org/events/event_single.aspx?id=643

*TIME:*
9:00- 3:15 (Coffee and Registration start at 8:00)

*PRICE:*
NERCOMP Members: $111, Non-Members: $211

*LOCATION:*
Southbridge Hotel & Conference Center Southbridge, MA.

Patrick Florance
GIS Manager & Senior GIS Specialist
Academic Technology
Tufts University
16 Dearborn Rd.
Somerville, MA, USA 02135
patrick.florance@tufts.edu
phone: 617.627.4235

Tuesday, December 19, 2006

More on Area Calculations

Remember when Keri wondered how to measure an area in her map?

Well, Kirsten wondered the same thing (what a concept...needing to know an area of a region in a map using GIS!! Why must it be difficult!?). She found an ArcScript called Graphic Measures (ArcMap 9) Worked like a charm. A separate window pops up and measures the length and area of the graphic that you've draw in your map. No need to make a shapefile.

http://arcscripts.esri.com/details.asp?dbid=13515

Tuesday, December 12, 2006

What's Harvard Up To These Days?

Seems Harvard University dropped the Geography department back in 1948. Now, thanks to geospatial guru and Harvard grad, Jack Dangermond, they have a swanky new GIS lab.

Here's a snippet (but you should read the whole thing):

Hello, Geotech
"Modeling our world," geography returns to Harvard


by Christopher Reed


Take your geographic information system (GIS) for a spin around the block. It’s easy. Sit at your computer, which you have loaded with GIS software, and call up on the monitor a street map of Greater Boston. Superimpose on it a second map showing the household incomes of the citizenry. Those with the best dental work are in the suburbs, struggling scholars in Cambridge, the poor in the inner city. Add a third layer of census ethnicity information. All these data are public and readily available. Top it off with lines and dots showing Massachusetts Bay Transportation Authority bus routes and subway stations. Almost everyone is near a stop except in one big chunk of the city south of downtown. Your multilayered map will reveal to you what you might not have otherwise perceived, that the poorest, blackest Bostonians, in Roxbury and Dorchester, the ones least able to afford cars, are the least well served by public transportation.

Saturday, December 09, 2006

And Finally...ESRI has released their Virtual Globe - ArcGIS Explorer


ESRI is pleased to announce that ArcGIS Explorer is now available for download. Use your ESRI Global Account to log in and download ArcGIS Explorer.

ArcGIS Explorer is a lightweight desktop client for ArcGIS Server, providing a way for you to publish ArcGIS Server capabilities within your organization or to anyone on the Web. ArcGIS Explorer is freely distributable and does not require any other ESRI software.
Using ArcGIS Explorer you can connect to content published by ESRI and others and fuse it with your own ArcGIS services or local data. You can create your own content or tasks for ArcGIS Explorer by authoring globes and tasks using ArcGIS Desktop, then publishing it to ArcGIS Explorer via ArcGIS Server.

Ready-to-Use Globe DataTo get started with ArcGIS Explorer, you can access a collection of ArcGIS Online globes including worldwide streets, terrain, boundaries and labels, political maps, physiography, and more. All of these are meant to form a foundation on which you can publish your own content. Once you have downloaded ArcGIS Explorer, you can connect to these via the ArcGIS Explorer Resource Center.

Centrally Managed TasksYou can use ArcGIS Server to publish custom tasks for ArcGIS Explorer. Tasks may include advanced geoprocessing and GIS analytic capabilities such as viewshed analysis, terrain profiling, and other ArcGIS Server functions without the need for programming. These tasks can be saved in specific maps for specific users, or they can be delivered independently. Because tasks are centrally managed on the server, once you make an update to a task, it's automatically propagated to all users that are connected to it.

Customizable and ConfigurableArcGIS Explorer can be customized to suit your preferences and needs by changing the startup globes and tasks which are available, changing the look and feel of the application, or authoring custom tasks.

ArcGIS Explorer also includes a software development kit (SDK) that can be used to extend tasks or can be used to implement completely custom tasks that are driven by other Web services.

Learn MoreLearn more by listening to a podcast [MP3 - 7.04MB] from ESRI.

Friday, December 08, 2006

ANNOUNCEMENT -- GIS Conference at Skidmore: January 10


"Call for Presenters for the Skidmore GIS Conference: January 10, 2006.

We plan two sessions at our Winter regional conference. Both will be discussion-based. The morning session will be on specific applications of GIS that go beyond the common applications. The afternoon session will be a discussion about how to handle/integrate such popular applications such as Google Earth with GIS. The tentative agenda will be:

9:30 AM Welcome and refreshments

10:00 AM to Noon: Creative, new, different applications of GIS.

Noon to 1:00 PM: Lunch

1:00 – 3:00 PM: How should academic GIS programs handle or integrate such web-based software such as Google Earth, NASA World Wind, etc.

If you would like to give a brief presentation of an application of GIS that may be rare or unique, or if you are integrating Google Earth, World Wind or other web-based geographic programs, let me know so that I can place you on the program to get the discussion going on these issues.
Please send your thoughts to me, rjones@skidmore.edu We look forward to seeing you on Wednesday, January 10th. More details will follow in a couple of weeks.

Please send your thoughts to me, rjones@skidmore.edu

We look forward to seeing you on Wednesday, January 10th. More details will follow in a couple of weeks."