Friday, February 27, 2009

Visualization Wiki

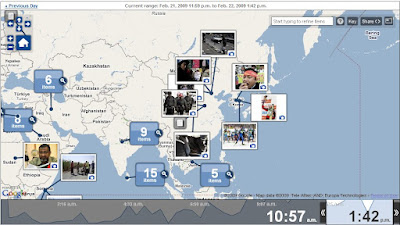
For all you visual learners out there, VisWiki is for you. I heard about VisWiki from VerySpatial and this wiki site is really rich with search capabilities. Here's what VisWiki has to say for itself:

VisWiki is a visual, intuitive, and interactive web interface to encyclopedic knowledge/information, especially of Wikipedia. It is designed to provide a fun place to learn stuff in an efficient manner.


Above you can see the different pre-configured categories (expand the plus sign to find out sub-categories) and the languages you can search in. Below I did a search of "tablet PCs" to see what they came up with.

Above in green #1 is my search of Tablet PCs. You can click a plus sign and get more information on, for instance, what's the difference between tablets and regular notebooks (laptops). There are 1,424 photos linked to the term 'tablet pc' (green #2). There's a tag cloud that, oddly enough, puts Toughbook as the largest strongly related link. And at green #3 there is this other kind of mental map showing items with a relationship to a tablet PC. You can probably tell that I don't know what #3 is but I do think it's kind of cool. Scroll down for more...


At green #4 shows that there are 674 videos related to 'tablet PCs' and if you want to search further and link off and out of this VisWiki page, at green#5 you can search Flickr or YouTube or Yahoo, and so on.

Tuesday, February 24, 2009

If Only I Taught Geography

... I'd really put my students to the test with this on-line geography game.

In the game How many countries can you name in 5 minutes? you are asked to type the correct spelling of as many countries as you can think of, all in five minutes. The clock start ticking as soon as you get to the page. It is not easy. Out of 195 possible countries, I got, well, I'm not telling. A key point to remember is to type in the country name and that enter each time. At end you can see how well you did, what percentage of countries are chosen, what are the 'hard' countries that you got and likewise, what are those 'easy' countries that you forgot about.

What you see above is what you get. No maps.

Thank you librarygrrl for the tweet.

Sunday, February 22, 2009

Geolocated Articles and More in the Washington Post

The Washington Post has a beautiful, interactive web mapping site featuring Post articles plus videos, photos and more. There is a timeline at the bottom and icons or photos on a global map. The site has an especially attractive interface. This is what the web site says:

"TimeSpace is an interactive map that allows you to navigate articles, photos, video and commentary from around the globe. Discover news hot-spots where coverage is clustered. Use the timeline to illustrate peaks in coverage, and customize your news searches to a particular day or specific hour. (Many Washington Post stories appear at midnight; others are published throughout the day as news happens). Click the ? In the upper right for help. "

The New York Times has had geolocated articles for nearly a year now, so I'm glad to see the Post doing the same. So is one of the readers of this blog.

When you click on a photo on the map you go to the photo spread from the article like the one above. Click on the arrow to see more photos. The shot shown below shows the agony of defeat

Saturday, February 21, 2009

WIPTE Conference - Tablet PCs in Education

The Workshop on the Impact of Pen-based Technologies in Education (WIPTE) for 2009 announced the Call for Papers, Posters, and Videos.

"WIPTE is open to anyone with an interest in instructional technology. A wide variety of disciplines are embracing Tablet PC's and similar pen-based devices as tools for the radical enhancement of teaching and learning. This conference is intended to leverage this shared passion and to identify best practices in the educational use of pen-based computing so that all educators may benefit from this next generation of technology. Each WIPTE paper presentation includes an assessment component as an important part of the presentation. The WIPTE program also includes keynote talks, poster presentations, vendor booths, panels, and special sessions.

WIPTE 2009 registration fee is $50.00. The registration site will open in March
."

Submission deadline is June 15, 2009


Thank you, Robert Heiny, at The Tablet PC Education blog.

Wednesday, February 18, 2009

Using Geography to Find Osama bin Laden

From "Finding Osama bin Laden: An Application of Biogeographic Theories and Satellite Imagery" by Thomas W. Gillespie and John A. Agnew, professors of geography at UCLA.

ABSTRACT: One of the most important political questions of our time is: Where is Osama bin Laden? We use biogeographic theories associated with the distribution of life and extinction (distance-decay theory, island biogeography theory, and life history characteristics) and remote sensing data (Landsat ETM+, Shuttle Radar Topography Mission, Defense Meteorological Satellite, QuickBird) over three spatial scales (global, regional, local) to identify where bin Laden is most probably currently located. We believe that our work involves the first scientific approach to establishing his current location. The methods are repeatable and can be updated with new information obtained from the US intelligence community.
Here's a Google Earth placemark of the identified possible locations for Osama bin Laden listed in the paper. This link will launch Google Earth and fly you to Pakistan.

Data for this study were quickly supplied at Geocommons and called "Structure Locations of Possible Hiding Spots of Osama Bin Laden, Parachinar, Pakistan, 2009" Thank you SeanGorman on Twitter.

Gillespie was interviewed on the Rachel Maddow Show last night.


Thanks, Andy Anderson, for the links to the paper and the video and reminding everyone that Gillespie was responsible for the study of night light from Iraq as a way to estimate the effect of the so-called "Surge".

I wonder what's next...a hit Hollywood movie about how cool it is to be a geographer? First, mathematicians and now geographers!

Call for Papers in Computers & Geosciences - Virtual Globes in Science

The Computers & Geosciences journal recently announced a call for papers (8 to 12 pages) for a special issue on Virtual Globes in Science. All manuscripts will be peer reviewed. From the above announcement:
"Online tools, such as versatile Web portals and Virtual Globes, are changing the way in which scientists and professionals store, access and view their data. In particular, Virtual Globes such as Google Earth (GE), NASA World Wind and Microsoft's Virtual Earth are providing an interactive three-dimensional virtual environment that enables Earth Scientists to conduct their research in a more natural and intuitive way than ever before."


Thanks, NITLE's Sean Connin for sending this along.

Monday, February 16, 2009

Mobile Computing in the Field: A Workshop for Higher Ed


I heard about this outdoor field-based workshop on mobile computing for the sciences for NITLE campuses. The deadline has been extended, so there's still time to get in on it! This is from the email this morning:

Greetings,

We write to let you know of an exciting upcoming summer workshop "The Outdoor Classroom: Recent Advances in Mobile Computing for the Field Sciences". This workshop will explore how GPS-enabled field computers can enhance teaching and research. It is being sponsored by NITLE as well as the ACM FaCE Project and all expenses, save for travel, will be covered by the workshop. Two participants per NITLE college are invited to attend. Please see The Outdoor Classroom web site or register here.

The deadline has been extended until February 20th, so please register soon!

Sue Swanson (Beloit College) and Jeff Clark (Lawrence University)

Sunday, February 15, 2009

Social Network For GIS User Community

A new social network for the GIS user community was recently created, the GIS Forum. With discussions forums on GIS software, AutoCAD, mobile technologies, and more, the GIS Forum offers a rich source of information that's not software specific. Industries like transportation, utilities, education, oil and gas, and public safety have their own sub-groups. There are also regional groups affiliations. Though this site is new, there is already activity on the wikis and forums.

I heard about the GIS Forum from a post on VerySpatial and it sounds like Matt Falkner of GottaBeMobile had a big hand in the project. The seeds of the the GIS Forum were sown on Twitter, apparently.

Friday, February 13, 2009

Digitizing in Google Earth - It Is Easier With a Tablet PC


I told a professor colleague of mine about the new features of Google Earth 5.0, in particular about the historical aerial photos for many locations. He works in Banda Aceh where the aerials available in Google Earth are from 2002, 2004 and 2005. He wondered aloud if we could easily digitize these aerial photographs plus some georectified older, scanned paper maps. Would it be possible in Google Earth? In ArcMap, digitizing is time-consuming (and a little dull).

The short answer is YES!
Here's how you digitize in Google Earth. Click on the Add Polygon button (circled in green) and start clicking away as you outline your feature. Notice I said 'clicking.' If you have an old-fashioned computer, you have a mouse, and digitizing is tediously done with a left-click. If you have a new-fashioned tablet PC (or a digitizing tablet like the Wacom variety), you can use the pen. I tried both ways and the pen on the tablet PC works great for digitizing in Google Earth.

Here are some of my early results.

Above is the outline of a barrier island, Ulee Lheule, from the 2004 aerial. If you click on the image you can see it much bigger and better. This digitized line was done with a pen and the larger image will show you the smoothness of the line. I smoothed the link even more with some further zoomed-in editing. It was easy to do.

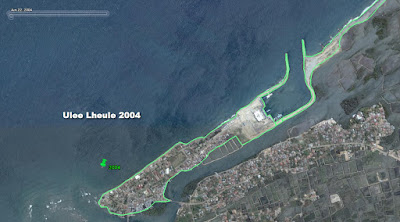
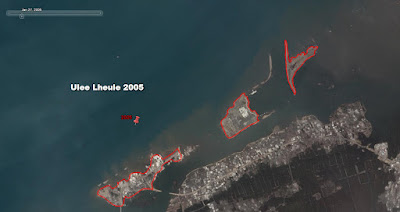
This is the same location, the island Ulee Lheule, but from the 2005 aerial. This was also digitized with a pen. Notice that there are three obvious sub-islands. You will need to create a separate polygon for each island. Create a folder to place your sub-polygons into and then do your adding of polygons.

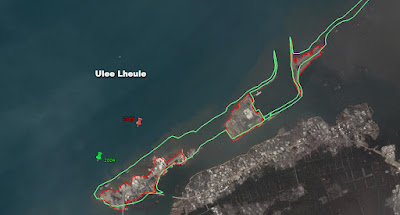
Finally, here are both layers from 2004 and 2005 on one image. Clearly there's some erosion that's taken place and/or inundation of ocean water on Ulee Lheule.

Now, to quantify the area and volume of land lost in one year will be the next step. Visually, it is obvious. My next step will be to try to measure the area of Ulee Lheule both in 2004 and 2005. In Google Earth, we can measure distance, but in ArcMap, we can measure area and volume.

Sunday, February 08, 2009

More Geography Games

Games are a great way to learn things while you're recreating/relaxing and geography is no exception. Actually, geography games are an ideal way to learn about places and where they are in the world. I've written about some geographical games before (look here, and here, and here, and here). The game above is from Addicting Games, is called the 50 States Game, and was told to me by my 10 year old son.


Another game that I just heard of is called Find Country: Improve Your Geographic Knowledge. See above, I knew where Egypt was. Thanks, TIPLine blog.

Monday, February 02, 2009

Google Earth 5.0 - Wow All Over Again

Remember when you first discovered Google Earth, how amazingly fun and easy it was to use? All the rich data, so beautiful to look at? Google has just added three terrific new features to the new version 5.0 that bring the excitement back to using Google Earth. It never left, of course, but these features are really worth taking a look at. Download Google Earth version 5 here.

Above is the new bathymetry, or ocean surface topography. I'm showing the east coast of the U.S. near New Jersey and New York Harbor because these ocean surface data show the nick mark where the paleo-Hudson River poured into the Atlantic Ocean as well as the broad continental shelf. Check out Bryan Alexander's blog for what he finds interesting about the bathymetry.

Feature number 2 - historical aerial photographs. This is huge. This is what we want to do in GIS software all the time. Looking back in time at how a place changes is a very powerful tool. With version 5.0 click on the Clock icon (circled in green below) to see what aerial photograph years are available for preview
Below I'm showing the three 'archival' aerial photographs for the Vassar College campus. Google isn't going back very far here in Poughkeepsie. We have aerial photos from the 1930s, but this is a great start. Below, in order, is 1995, 2004 and 2006. I've circled the time line bar that allows you to know when the photographs were taken; you can easily slide back and forth through time. You can see that Vassar, since 1995, has gotten a new gym, a new observatory and a new parking lot.


The third new feature is the Tour.
You could always make a tour in Google Earth. I think tours are a great way to fly up a river or zoom around the world quickly, but now Google has added a Record a Tour icon to the toolbar (circled in green above). I tried it out rather quickly and it is a breeze. It records your movements in Google Earth and your voice. This will be terrific for presentations when you're not sure of the strength of internet access. I'm not sure how Google has done this, but the movie making feature in the Pro version never worked for me. This might be the ticket.

Here is my recording using the Record a Tour function. You need version 5.0 to play it.

Finally, this feature may have been part of a previous version of Google Earth and I just didn't notice it. It is the Add Content button in the Places layer (circled in red below), When you click on Add Content, you are taken to a Google directory where you can find some of the more interesting data layers that have been built for Google Earth.
This new version of Google Earth seems to have caused quite a buzz. I first heard about it in Twitter. Thanks Dan Cohen. Also, check out Google's LatLong blog and The Official Google Blog for more information. Or the Ogle Earth blog that linked to the New York Times article about the new version. See the image below from the Times article.