
The other kudo is the newly revamped Environmental Studies program's web page that features "Field opportunities" and show ME helping out a student using a tablet PC. This shot was taken on the same day as the one above. Another nice mention under 'Campus facilities' is that we have a "GIS laboratory," though they used this blog's link and not the GIS lab's own, out-dated web page. Here I am...
Tuesday, December 23, 2008
Shout Out to Tablet PCs at Vassar

Monday, December 22, 2008
GIS in Higher Education Conference at Skidmore College

Skidmore College is hosting a GIS conference January 9, 2009, geared towards those of us in colleges and universities. These conferences that Skidmore has put on before are very effective for meeting other geospatial folks in higher education and hearing what your GIS colleagues are doing. I highly recommend this conference. Here is what Skidmore's Alex Chaucer says:
The Skidmore College GIS Center will be hosting a regional GIS conference at Skidmore College in Saratoga Springs, NY, on Friday, January 9th, 2009. We will be focusing on GIS in the college setting. Some possible topics for presentations/conversation include: GIS and statistics, supporting student and faculty GIS research, community GIS, and creative applications. We also are open to other topics, and if there is something that you think may be a good discussion topic, please let me know.
Please RSVP to Alex Chaucer, achaucer (at) skidmore.edu
Google Earth, Sanborn Maps and NYC in 3D

You don't need your own plane or helicopter to get remarkable views of New York City. Check out a great post at the Ogle Earth blog on the combined project of Google Earth and Sanborn maps integrated with accurate photography of lots and lots of New York's buildings. Stefan also has some really nice screen captures to highlight this interesting project. Just zoom into New York City in Google Earth to see these buildings (with Buildings layer turned on, of course). Rendering was pretty quick.
Monday, December 15, 2008
Landsat Data from the USGS

Landsat imagery data going back 35 years or more are available on the USGS web site. Read about the landsat program on the NASA site and find the data here on the USGS site. Enable Java and allow for pop-ups on this site. See below for a look at the data download window.

The USGS's EarthExplorer is another remote sensing and geospatial data download site worth checking out too.
Thanks VerySpatial .
Sunday, December 14, 2008
Creating Your Own Maps With Google MapMaker
 Adding to the democratization of map creation and wikification of mapped data, Google has made available Mapmaker. From the Google LatLong Blog: "Map Maker now allows people to create complete maps for 164 countries across the world. As we expand the launch of Map Maker to more countries, we never forget that for any user it's all about the world they live in." Above is the location of the best bake and shark in Trinidad.
Here's a how to get started in Map Maker page.
I think that this sort of map creation has been available through Google Earth, but there's still a slight disconnect for those folks who don't want nor know how to download the Google Earth geobrowser (like my in-laws). Making maps in a standard browser is now even easier.
Edited 12/22/08
So I tried out a post/placemark showing one of my most favorite places to eat, Richards at Maracas Beach in T&T. I placed the placemark and got back a response. Surprise! Someone is watching out for accuracy!
Action : Comment
Remarks : Hey, all that I could see there is water, are you sure about the location of this edit, if not please undo this.
signed, Google Map Maker
My bad. I tried again.
Action : Comment
Remarks : Hi, I am not able to locate the feature from the image.. Are you sure about the location???
signed, Google Map Maker
Wow! And I call myself a GIS guy. OK. So when I turned ON the satellite photos I was able to see that I was NOT in a place where there could be a yummy shark and bake shack because I was located in a forest. Again, my bad. I tried once more and, TA DA!, I think I got it right because the Google Map Maker didn't get back to me and here is the placemark (below). I do like knowing that there's some quality assurance/quality control to Google Maps, don't you?
Tuesday, December 02, 2008
NERCOMP Pen-based Technologies SIG
 Keri VanCamp and I gave a talk at the NERCOMP mini-conference as I discussed previously. There were four sets of speakers and all but we discussed pen-enabled technologies within a classroom setting. Our presentation, of course, focused on our use of tablet PC in 'outdoor' classrooms. Though this is a talk that I have given and modified from the first time I gave it (NERCOMP annual conference), each time something is added and I hope each time it improves.
I thought that this was one of the better NERCOMP SIGs that I've been too. The first speakers from WPI brought in a lot of pen technology tools and discussed where their focus is at this point. They plan to deploy Sympodiums by Smart to their technology-rich classrooms. I think that sounds like an ideal solution between a Smartboard and a tablet PC. Another interesting and notable point made is that we are seeing pen-technologies sold in places like Target and Circuit City...Wacom tablets and LiveScribe, to name but two. I believe we are starting to see the mainstreaming of pen technologies. Frankly, the more varied technologies we have to choose from not just as educators but as consumers the better for those of us with different learning styles and preferences.
Another issue that came up was the use of wireless with a tablet PC, especially in a classroom with many tablets. It can give troubles if your wireless is encrypted, but I'm not that versed on it. This is troublesome since we are investigating a wireless/projection tablet implementation.
Lastly, a point that came up is that there was a sense that tablet PCs have been slow to take off in higher education because of the heavy Macintosh use on our campuses. This is likely true. One attendee said his experience with the Axiotron was less than satisfactory. We don't have pen-enabled Macs now, it's been but a rumor for years, it probably will not happen that Macs will make the tablet PC of the higher educator's dreams.
By the way, no one gave a talk on Smartboard use. Not surprising but notable.
Friday, November 28, 2008
I'm A Tablet PC Video - What's Missing?
I haven't heard much of what went on at the WIPTE conference in October, but I did hear about this video. It's a take-off of the I'm a PC commercial. I'm posting about it because I'm fond of tablets, of course, but also, these folks missed one of the greatest reasons to have a tablet PC. They should redo this and and have some geologist in boots and sunglasses saying, "I'm a tablet PC and I'm collecting tsunami inundation measurements." Then they can add an ecologist in hip waders saying, "I'm a tablet PC and I'm mapping invasive species." Nobody asked me.
Thanks, GottaBeMobile.
Friday, November 21, 2008
Mapping Pirate Activity
 I rarely watch the news. I guess I've started back up again with the heartening news of the recent election. Anyway, I heard about all this 'pirate' activity in the area near Somalia involving the hijacking of big cargo and oil freighters. Sounds scary, right? And it is, but when looking at the ICC Comerical Crime Services web mapping of pirate action, you see that these high seas terrorists are all over the place.
Sunday, November 16, 2008
Short Videos Showing How To Do Functions in Geospatial Software
I recently started using TechSmith's Camtasia and hope to make some short, instructional videos showing how to do different functions in GIS and geospatial software. I'll put these videos on the GISatVassar YouTube site. And if anyone wants to see a particular function done as a video, let me know at mestewart (at) vassar (dot) com.
Wednesday, November 12, 2008
Google Earth and Ancient Rome
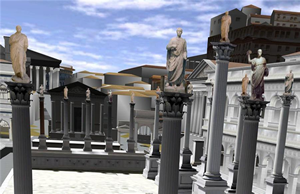 Now this is good. It took awhile to be made available but it is there now so I'm going to blog about it. Google Earth added an ancient Rome layer under the Gallery category. In it is a model of Rome circa 300 AD, which is really amazing. I learned about this Rome layer on the Google video.
Thankfully it is in easy-to-use Google Earth and not in something like Second Life. There are plenty of educational opportunities with this layer and I am sure there will be more clever layers to follow. The matchup of Google Earth with SketchUp is a great combination for educational purposes. This application of using historical data with real terrain is perfect for Google Earth and the kind of thing that people try to re-create in Second Life where it just seems forced. But I've never been a Second Life fan and now I wonder when Google will come up with Roman warrior avatars driving chariots around Circus Maximus. Now THAT would be educational!
 I heard about this new Rome layer early this morning and thought that, to view the new layer, I must download Google Earth again. I don't think that is the case. My Update Google Earth function said that I had the latest version, but I did not see the Ancient Rome layer. It just took longer than I expected to see it in my Layers list (circles in green below).
 Thanks, psychemedia and Google LatLong blog and Ogle Earth blog, where you'll get a lot of background information on how this project came into existence.
Monday, November 10, 2008
NERCOMP: Pen-based Technologies for Teaching and Learning
 If you're in the area of the northeastern part of the United States and interested in pen-based teaching technologies, check out the December 2 NERCOMP (Northeast Regional Computing Program) special topic session "Pen-based Technologies for Teaching and Learning." I'm co-presenting with Keri VanCamp on "Enhancing Field-based Classes Through the Use of Tablet PCs for Pen-based Data Collection" at 10:10 am. Looks like all the other presenters are talking about keeping the tablets INSIDE the classroom. Lunch included.
Thursday, November 06, 2008
More on Election Maps
 Today is another great day for maps in the New York Times. The Times added a new link, Voting Shifts (circled in green above), that they didn't have yesterday when I posted. What is shown above is the change in how a county voted from 2004 to 2008. Use the slider bar to see the dramatic change in voting patterns from 1992 to last Tuesday.
If you have a paper version of the Times, the headline reads, "For Most of the Country, a Blue Shift" in a section called After the Vote. In paper, the colors are more saturated than on the web and there are data for Alaska. There's also something very satisfying about opening up the newspaper and seeing full-color maps and charts and cartograms (!) of geospatial information. The Times has printed maps like these in 2000 and again in 2004.
Wednesday, November 05, 2008
The Election is Over: Take a Look at the Maps
 The New York Times has done it again with an informative, interactive web map of the presidential election results. When you hover over a state, you get the results by state. When you click on a state (try New York, for instance), you see the results by county (my third map, below). There's a time-slider (circled in green above) so you can go back and see the differences from the past.
 Click on County Bubbles and see the map above which is instantly recognizable as showing that the more densely populated counties went blue and more rural areas went red, generally speaking.
Tuesday, November 04, 2008
Talking About Funding Technology in the Classroom
 The financially tight times are hitting us all and academia and Vassar College is no exception. Each Fall we submit budget requests for projected needs for the coming academic year. I recently made my requests for some various instructional technology needs but was told that, given President Hill’s recent statement, there would be slim to no money and that, if we did get any money, it would have to be heavily justified. That’s fine. My feeling is that all of us in my group of instructional technologists should not go hat-in-hand to anyone at the college at this time and we should be trying to find our own funding sources. Now, what I really think is that all of us in instructional technology should be writing a detailed justification for any item that we ask for, whether it is a new piece of software for teaching in a lab, a site license for some software that has taken off on campus, or a new piece of equipment that professors are asking for in their teaching, or you, the instructional technologist, thinks is the next great thing since the toaster. The practice of critical writing to argue one’s point is rarely required of us. It should be. We might see far fewer high-expense items used by one professor and more low-cost to free solutions used by, well, more than one professor. What I am saying is that we instructional technologists should be writing grant proposals.
 I discovered just recently, when clicking through the MacArthur Digital, Media & Learning awards, and trying to figure out how we could get one, a white paper written by the Economist Intelligence Unit and sponsored by the New Media Consortium discusses results from surveys of 289 executives at higher education schools and corporations. The report is titled, "The Future of Higher Education: How Technology Will Shape Learning." Rather than distill the whole report, I encourage you take a look at it, but what I found most interesting and highly relevant for our current financial situation was this finding on corporate/academic collaborations:
Corporate-academic partnershipswill form an increasing part of the university experience, at a time when locating funding and controlling costs are key concerns, and when only one-quarter of university chief information officers (CIOs) have a place at the table when it comes to setting strategy. To attract corporate partnerships, institutions will need to demonstrate a commitment to advanced technologies. Identification of funding sources, team formation, grant proposal writing, and management of grant-funded projects has been an interest of mine for years. If I wanted to get my graduate school research work done, I needed to write proposals and win grants.

As many of you know because I blog about it from time to time, we have a tablet PC program, or a Mobile Mapping lab, in which we use tablet PCs for outdoor geospatial education. We teach with tablet PCs outside using GIS and other data-collection software and the program has been very successful. Could we have purchased 15 to 20 tablet PCs back in 2004 at a cost of about $2,000 each, plus all the software, plus the GPS receivers? Well, if we could, I never asked. To think on it now, it seems absurd to spend over $40,000 on something that 'seems' like a good idea. But a 'good idea,' if written well and sent to the right funding source, can turn into a successful instructional technology implementation. We got our first Hewlett-Packard grant in 2004, we replaced our tablet PCs this Spring with Dean of the Faculty funding that was pledged before we sent in the first HP grant, and with a second HP grant we made a video highlighting our mobile mapping project.
Monday, November 03, 2008
Just Not Into It
So Microsoft's chief software architect, Ray Ozzie, is not that into tablet PCs. Calling tablet PCs "truly niche" is something I've heard more than a couple of times around here. But as we see the price of tablet PCs come down and the touch screen or "surface" alternatives continue to be priced formidably high, I will continue to hear professors asking to borrow one of those "pen computer things." I predict that soon there will be a small percentage of faculty members here who ask for a tablet PC instead of a laptop or desktop machine. Try to put a Surface on your office desktop or run a GIS app on an iPhone!
Thanks, Rob, at GottaBeMobile and
Warner, at GottaBeMobile.
Thursday, October 30, 2008
ESRI Seminar on New Features in ArcGIS 9.3
 I went to an ESRI “Improving Your Entire GIS Workflow” or as it used to be called “What’s New with 9.3” seminar recently and I want to report back what I learned. You can also open up your recent copy of ArcUser magazine to find out the top ten features new with ArcGIS 9.3 and save yourself a trip away from the office.
Note: I have not installed 9.3 on any machine as yet so all that is written here are from notes scratched on a note pad. I haven't tried any of this out.

First off, notable to me and a validation of sorts, the ESRI presenters were using Windows XP.
There was a marked excitement from the reps that ESRI was moving towards a more integrated web approach to data delivery and analysis. “We are moving from mainframes to PCs to the web.” Okay, welcome to 2005 and the launch of Google Earth. There was a nice demo showing the ease of use of ArcGIS Online data. Go to File -> Add Data from Resource Center.
There is improved backwards compatibility with 9.3 with 9.x versions. That should be good.
ESRI is supporting more data formats: web coverage service, web feature service, enhanced mapping services, FME 2008 engine, support for new FDO, GeoRSS, Autodesk 2007, City GML, and enhanced KML delivery. They “improved our importing of KML.” Yeah.
We can convert graphics to features. I thought we could do that in 9.2, but this is especially useful when using a pen and tablet PC.
ArcReader allows for inking and you can Export the Markup.
There is a new mosaicing tool as part of the new Image Service. This might be only with ArcInfo, so be careful. In toolbars open the Image Service tool. You can define the extent (outlines) of your orthophotos and show overlaps in your tiles. The Image Service also looks very helpful for managing multiple years of orthophotos or other rasters.
We were told to go check out the ESRI Resources page, so you should.

If you go to resources for ArcGIS Desktop or ArcGIS Explorer, click on Content and Layers and you can get to some freely available data layers (see above).
You can use a graphic drawn from the Drawing toolbar to clip a raster. That is cool because you used to have to create a shapefile of your clipping shape and then use Clip.
There are new Spatial Analyst (we DO own this!) capabilities: weighted regressions, proximity analysis, scatter plots, and ordinary least squares.
The demo of ArcGlobe was painfully slow. It was not good. It did not convince me that we should be using ArcGlobe in our teaching. Flying around from place to place was clunky. Perhaps they were on wireless and that was why ArcGlobe was so slow.
This was funny “3D is going to be a very growing area in GIS.” Going to be?!
In ArcGIS Explorer (free data viewer, GIS-lite) you can access a range of web-accessible data. You can import .csv files.
 That was my day. As is usually the case, it is nice to talk to the ESRI people face-to-face and ask questions. We still haven’t loaded ArcGIS ArcView 9.3 but I plan to for the Spring 2009 semester. Then we can really try out some of these new features!
Monday, October 27, 2008
Newspaper Candidate Endorsements
 This is a captivating mapping site showing 2008 and 2004 presidential candidate newspaper endorsements. Some interesting flips from 2004 to 2008. Missing: the Anchorage Daily News' endorsement of Barack Obama this morning.
Sunday, October 26, 2008
If the World Could Vote for the Next US President
 More interesting mapping, this time asking the WORLD to cast a vote for either of the two major party candidates for president on the United States. The results as of this writing are stunning.
 Thank you, Kirsten!
Saturday, October 25, 2008
Electoral Map in the New York Times

Monday, October 20, 2008
What if You Don't Want to Tilt as You Zoom into Google Earth?
If you do not want your Google Earth zoom function to tilt as you zoom into a location, here is how to change the operation. This happens when you use the Plus sign on the right-side navigation tools but not when you zoom in with a mouse wheel.

Go into the Tools -> Options... menu and then click on the Navigation tab. Uncheck under Navigation Controls the box that says Automatically tilt while zooming (circled above). Google Earth 4.3 made the default setting to tilt as you zoom. Why would you want to do that?
Wednesday, October 08, 2008
Tablet PCs in Field-Based Classes: A Video Documentary
We made a video that I'd like to share here. It has everything that this blog seems to be about, tablet PCs, mapping, instructional technology. I mentioned this video project in my last post, but I think this deserves its own post. In April we got funding from HP Philanthropy & Education to make a student-produced video documentary showing other students and professors using tablet PCs in classes. At Vassar, we teach with tablet PCs primarily in an outdoor, field-based setting. The following is the resulting video. It is 11 minutes long, so we made several shorter 'episodes' for each of the individual classes that we highlight. We hope you enjoy it.

This episode shows how Anthropology Professor Lucy Johnson uses tablet PCs in her Field Archaeology class. Professor Johnson is involved in an on-going excavation of a site at the Mohonk Preserve and her students are helping with that research. It is believed that the site was a shelter over 6,000 years ago. The students document the test pit excavations using a tablet PC and Word for drawing and writing up their observations.
In this episode, Keri VanCamp is showing how to document and map an invasive species at the Vassar Ecological Preserve. Biology Professor Robert Fritz teaches Ecology at the Preserve and his students are part of a longitudinal study of mapping the expansion of the invasive garlic mustard. The students use tablet PCs, a camera, a Word document with the various species they might encounter, and Photogrid (used for mapping ecological research sites).
And this episode shows Earth Science Professor Kirsten Menking with her Geomorphology students along Vassar's Casperkill creek, mapping the stream meanders. They are using a tablet PC, ArcGIS software and GPS receivers as well as older aerial photographs to measure the amount of stream migration over time.
And finally, this is a shorter version of the longer video. It is simply the beginning and the ending of the longer video, but we think it gives a succinct overview of how Vassar is using tablet PCs in some of our science classes.
Tuesday, October 07, 2008
At the Geological Society of America Meeting in Houston Talking About Tablet PCs, Mapping, and Higher Education
 I’m at the GSA meeting for the first time in five years. The last time I went to GSA was in 2003 in Seattle at which time I discovered tablet PCs, so this trip feels a bit like coming full circle.
I gave a talk in an interesting session today, full of geoscientist educators. The session was called “Advances in Using Recent and Emerging Technologies to Facilitate Learning of the Geosciences in the Classroom, Laboratory, and Field.” I want to tell you about some of the interesting things that were discussed.
First, the talk I presented. I gave a talk very similar to the one we gave and the NERCOMP meeting in March, but today's talk was titled “Taking It Outside: Using Tablet PCs to Facilitate Learning In Undergraduate Field-Based Earth Science Courses.” The slides are here and below. I also showed for the first time to a live audience our new tablet PC video. That part could have been better; I think the laptop that I used couldn't handle the .mov file. But I will link here to the YouTube site and our Vimeo site so you can see the GOOD quality videos. I think the talk went well. I felt good about the fact that little Vassar College is doing cool stuff with technology along-side the likes of UC Berkeley, Duke and Univ of Michigan.
Not shown at GSA but still something I'd like to share, is our 11-minute long documentary on tablet PC use in field-based classes at Vassar College, here in Vimeo.
Declan De Paor showed us how he uses scanned geologic and topographic maps in Google Earth in his talk called “Deconstructing Classical Geologic Maps Using Google Earth's Keyhole Markup Language.” De Paor Photoshops TM out the extraneous edge material on the maps to make the KML smaller, and he talked about using Super Overlay to reduce the size of the image files to make the KMZ a manageable size. He showed how he uses cross sections in his KMZs and then uses the timeline feauture to 'play' the relative motion. Very interesting talk by a powerhouse in geology using Google Earth and someone who I have discussed before.
 Steve Kluge, in “Encounter Earth: Interactive Geoscience Explorations,” also discussed ways geoscience educators can use Google Earth in the classroom and showed off his new textbook from Prentice Hall with the same name as the talk. The book has many geological topics covered with exercises included. It looks like a great addition to the world of off-the-shelf geospatial exercises.
The other two tablet PC discussants were George Brimhall of UC Berkeley talking about the use of GeoMapper and tablet PCs in advanced field mapping, field camp. And Thomas Hoisch of Northern Arizona Univ talking about the use of tablet PCs for professors to teach about and students to learn how to engage with optical mineralogy concepts. I have very un-fond memories of optical mineralogy, so if Hoisch can design a way to make the topic easier to understand and grasp for his students, bless him!
Friday, October 03, 2008
Seven Things to Know About Geolocation
 The latest in the 7 Things You Should Know series from the Educause Learning Initiative or ELI is on Geolocation. Regarding the teaching and learning implications of geolocation:
Student, faculty, and researchers across the disciplines stand to benefit from adding a layer of location information to data and systems....Learning activities that formerly required taking a field trip might be accomplished through technologies that use location data to coordinate information and resources. Geolocation also provides students another avenue to contribute to the body of knowledge used by professionals in their discipline.
Sunday, September 28, 2008
Nice Map on the Cover of the New York Times Magazine

Thursday, September 25, 2008
Back to Red and Blue Maps
 Who can forget the red states/blue states maps of 2000 and then 2004? Dreadful cartography, I know. But if you're trying to paint a picture of potential electoral college outcomes, this is what we have. Thank you, AnyGeo Blog, for pointing out this great site for election watchers and map aficionados. David Leip's US Election Atlas, does a great job of keeping us up-to-date on election predictions, state by state. Remember, though, that Leip likes to use blue for Republicans and red for Democrats.
Wednesday, September 24, 2008
Google Earth Games

Wednesday, September 17, 2008
Installation Steps for ArcGIS Extensions
 One of my constituents is working on the west coast and has installed ArcGIS 9.x using the disk that I gave him. He has the ArcView license plus the 3D and Spatial Analyst extensions. However, there is a trick to making sure you get your extensions installed, and the following post is how you do it. See above for how to get started with the install.
 Next, click Install ArcGIS Desktop.
 THEN WAIT WHILE THE COMPUTER DETERMINES IF THERE'S ENOUGH AVAILABLE SPACE.
 If you have already tried to install ArcGIS plus your extensions and find that your extensions are not showing up, you will click Modify (shown above). If this is your first time with the installation process, click Custom install (not shown).
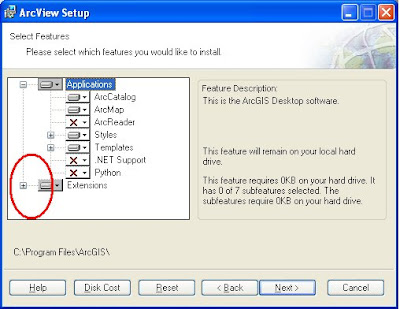
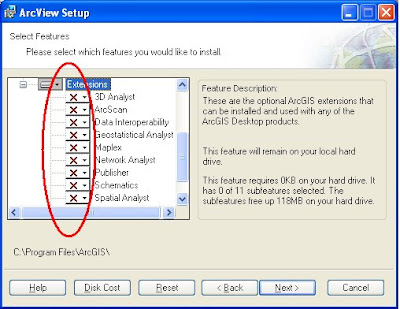

Now, click on the drop-down arrow next to the extension(s) you wish to install, in the case above 3D Analyst and Spatial Analyst, and you will get a little hard drive icon that says "Will be installed on local hard drive." Click Next and Next and your extension installation should be successful.
You will be prompted at the end of the installation process to add your alpha-numeric license code. The the first time you launch ArcMap, go to Tools -> Extensions and then check on the extensions that you loaded (and have licenses for).
Monday, September 15, 2008
Google and Geospatial Data
 I would like to recommend the September 14 Very Spatial podcast for an informative interview with Dylan Lorimer and J.L. Needham of Google. The main topic of this interview (about ½ way into the podcast) was Google’s effort to partner with local governments for data sharing. Some of their answers were surprising to me so I thought I should share. Here are some highlights.
The data (imagery, elevation, transportation, etc.) that Google uses for Google Earth, Google Maps and Maps for Mobile are collected from every county in the U.S and are provided on hard media, or hard drive delivery. Of course, that kind of coverage is not nearly as comprehensive internationally, but Google is always working on it and has representatives all over the globe trying to establish partnerships for data sharing.
Google has, since it launched Google Earth and Google Maps, been rather secretive about their data, how it is gathered, who provides it, projection information, and so on. But in the last six months Google has been working on establishing a “front door” for open access for data sharing at: gisdata (at) google (dot) com.
Lorimer and Needham were enthused by the recent ESRI Users Conference and met with many jurisdictions and have become more open to inquiries and offerings of a variety of data types. Of course the standard data desired are aerial imagery, they also seek 3D models (textured or not), terrain data, elevation models and transit system data.
Google is not in need of U.S. baseline data but do seem to seek parcel data, address points and routing data. Lorimer and Needham were clear that local data sources, local governmental agencies, are the authority of the data and they trust the integrity of the data from these jurisdictions. Google has a program called “Cities in 3D” to reach out to local jurisdictions for their localized geospatial data.
To assess where to provide the most up-to-date and complete data, Google maintains heat maps of where their users are and where they are looking in Google Earth and Google Maps.
About the public versus private partnerships and the question that some might ask “why should I pay for the GIS group when it’s already available in Google?,” Lorimer and Needham had three points to make. 1) Google attributes the source jurisdiction of any given data set, 2) they blog about any partnership they’ve assembled and promote how-to information on the web, and 3) Lorimer and Needham said we “engage with law makers who ask uninformed questions like ‘why do we fund our GIS office or agency when all these maps are free on Google Earth?’ We help them understand that it’s because of that funding, because of that public investment, that places like Google Earth and many others are available to the public.”
Google is trying to utilize the tremendous public investment in geospatial data and get that magnified. To bring those data out of the small circle of people who use the data and provide it for everyone. They feel this is transformational.
Google is working on a self-service approach to data sharing. So a person in a jurisdiction could upload updated imagery, for example, to a web site. In the next couple of months, Google will make it more clear and streamlined as to how to share geospatial data that Google is looking for, but for now, it seems that one should go to gisdata (at) google (dot) com.
To hear the whole Very Spatial podcast:
Click to directly download MP3
Click to directly download AAC
Or go to Very Spatial.
Thursday, September 11, 2008
Buy "Mapping Our World" and Get ArcGIS 9.3 for a Year
 From ESRI Press, Mapping Our World Using GIS, by Palmer, Palmer, Malone, and Voigt, comes with a one-year license for ArcGIS 9.3. Here's a link to Amazon.
Wednesday, September 10, 2008
Fall Semester, ArcGIS and Vista
 For our Fall classes, we did not upgrade to ArcGIS 9.3 ® and we did not upgrade to Microsoft Windows ® Vista TM and we especially did not go for a new Macintosh lab with a Parallels or a Boot Camp, or whatever. The new copies of ArcGIS 9.3 landed on my desk right as I was leaving for my summer hiatus, so it did not get burned onto our new machines in the GIS lab or Scientific Visualization lab. We did get very souped up new machines in both of these lab, however, all of the specs I don't have at hand. Not that there are problems with ArcGIS 9.3 and Vista, we're just not 100 percent confident to make the switch. I see there is already a planned-for-November service pack for the new ArcGIS 9.3. Perhaps we'll wait until Spring to upgrade to 9.3.
Friday, September 05, 2008
More Hurricane Tracking - In Google Earth
 If you're interested in following the hurricanes during hurricane season, Google Earth has added a layer in their Weather category that makes it easy. I read about this in the Lat/Long Blog when Hurricane Gustav was threatening.
Under Layers -> Weather -> Hurricane Season 2008, you'll get the latest, active hurricanes. This information was also courtesy of the Lat/Long blog.


